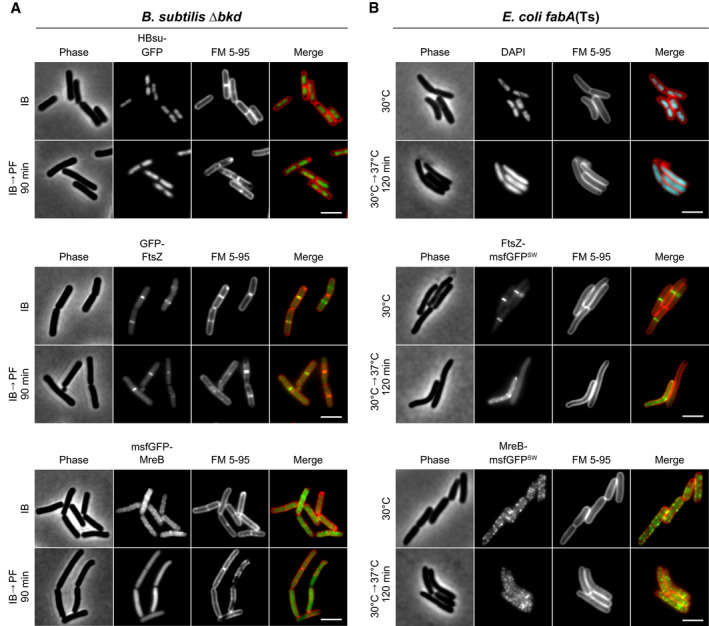
Figure 4. Consequences of low membrane fluidity on and cell morphogenesis.

- Images of B. subtilis Δbkd cells stained with membrane dye FM 5‐95 and expressing GFP fusions of DNA‐binding protein HBsu (top), cell division protein FtsZ (middle) or cell elongation protein MreB (bottom). Cells were grown with IB or depleted for precursors for 90 min (IB→PF). For further examples and additional time points, see Appendix Fig S4A.
- Images of E. coli fabA(Ts) cells stained with FM 5–95 for the outer membrane and with DNA‐intercalating dye DAPI (top) or expressing GFP sandwich (SW) fusions to the cell division protein FtsZ (middle) and the cell elongation protein MreB (bottom), respectively. Depicted are cells grown at 30°C or with a temperature shift to 37°C for 120 min. For a more detailed view on the influence of low membrane fluidity on membrane dissociation of RNase E as well as on the cell division machinery, see Figs EV2, EV3, EV4, EV5 and Appendix Fig S5. For further examples and additional time points, see Appendix Fig S4B.
Data information: (A, B) The experiments are representative of biological triplicates. Scale bar, 3 µm. Strains used: (A) B. subtilis HS541, HS548, HS549; (B) E. coli UC1098, BHH500, BHH501.
