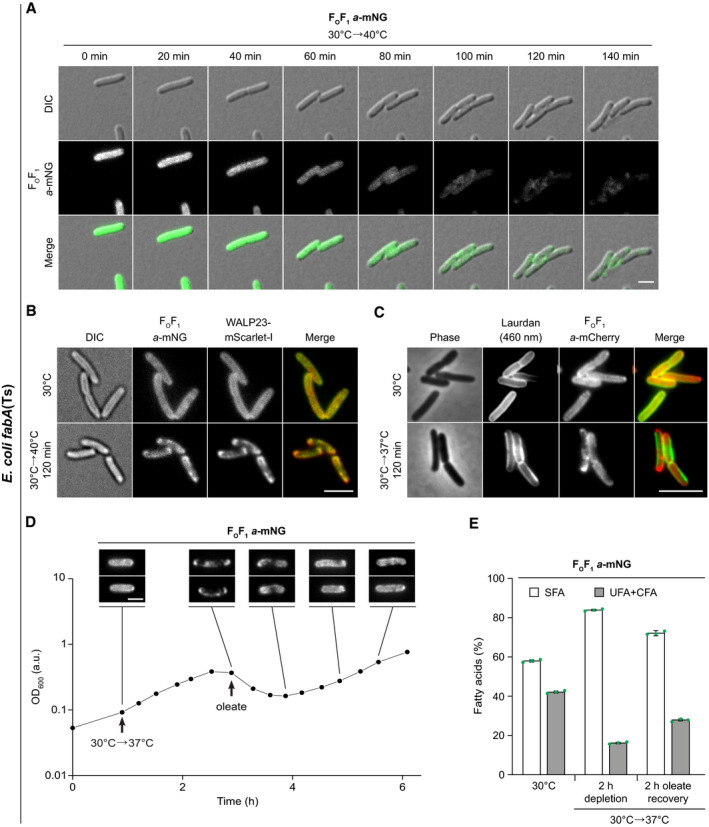
Figure 6. Partitioning of membrane proteins into fluid domains of phase‐separated plasma membranes.

- Images of E. coli fabA(Ts) co‐expressing WALP23‐mScarlet‐I and FOF1 a‐mNG grown at permissive 30°C or shifted to non‐permissive 40°C. For fluorescence intensity correlations, see Appendix Fig S8D. For corresponding images of E. coli fabA(Ts) cells co‐expressing inner membrane marker FOF1 a‐mNG and outer membrane marker OmpA‐mCherry, see Fig EV5.
- Images of FOF1 a‐mCherry‐expressing E. coli fabA(Ts) grown at 30°C or shifted to non‐permissive 37°C and stained with Laurdan. For fluorescence intensity correlations, see Appendix Fig S8E.
- Growth behaviour of FOF1 a‐mNG expressing E. coli fabA(Ts) after shift from 30°C to non‐permissive 37°C and upon recovery through exogenous supplementation with UFA oleate (cis‐Δ9‐C18:1). The corresponding reversible segregation of FOF1 a‐mNG is shown above the growth curve. For further controls, see Appendix Fig S11A. For a comparable fluorescence time lapse analysis of mNG‐labelled glucose permease PtsG, see Appendix Fig S12.
- Fatty acid composition of E. coli fabA(Ts) cells (same cell batch as in D) upon growth at 30°C, upon depletion of UFA by incubation at 37°C for 120 min and upon recovery by oleate supplementation for additional 120 min. For detailed analyses, see Appendix Fig S11B–D.
Data information: (A–D) The experiments are representative of biological triplicates. (E) The histogram depicts mean and SD of biological triplicates. DIC, differential interference contrast. Scale bar: (A, B, D) 2 µm; (C) 3 µm. Strains used: (A, D, E) E. coli MG4; (B), E. coli MG4/pBH501; (C), E. coli LF6.red.
Source data are available online for this figure.
