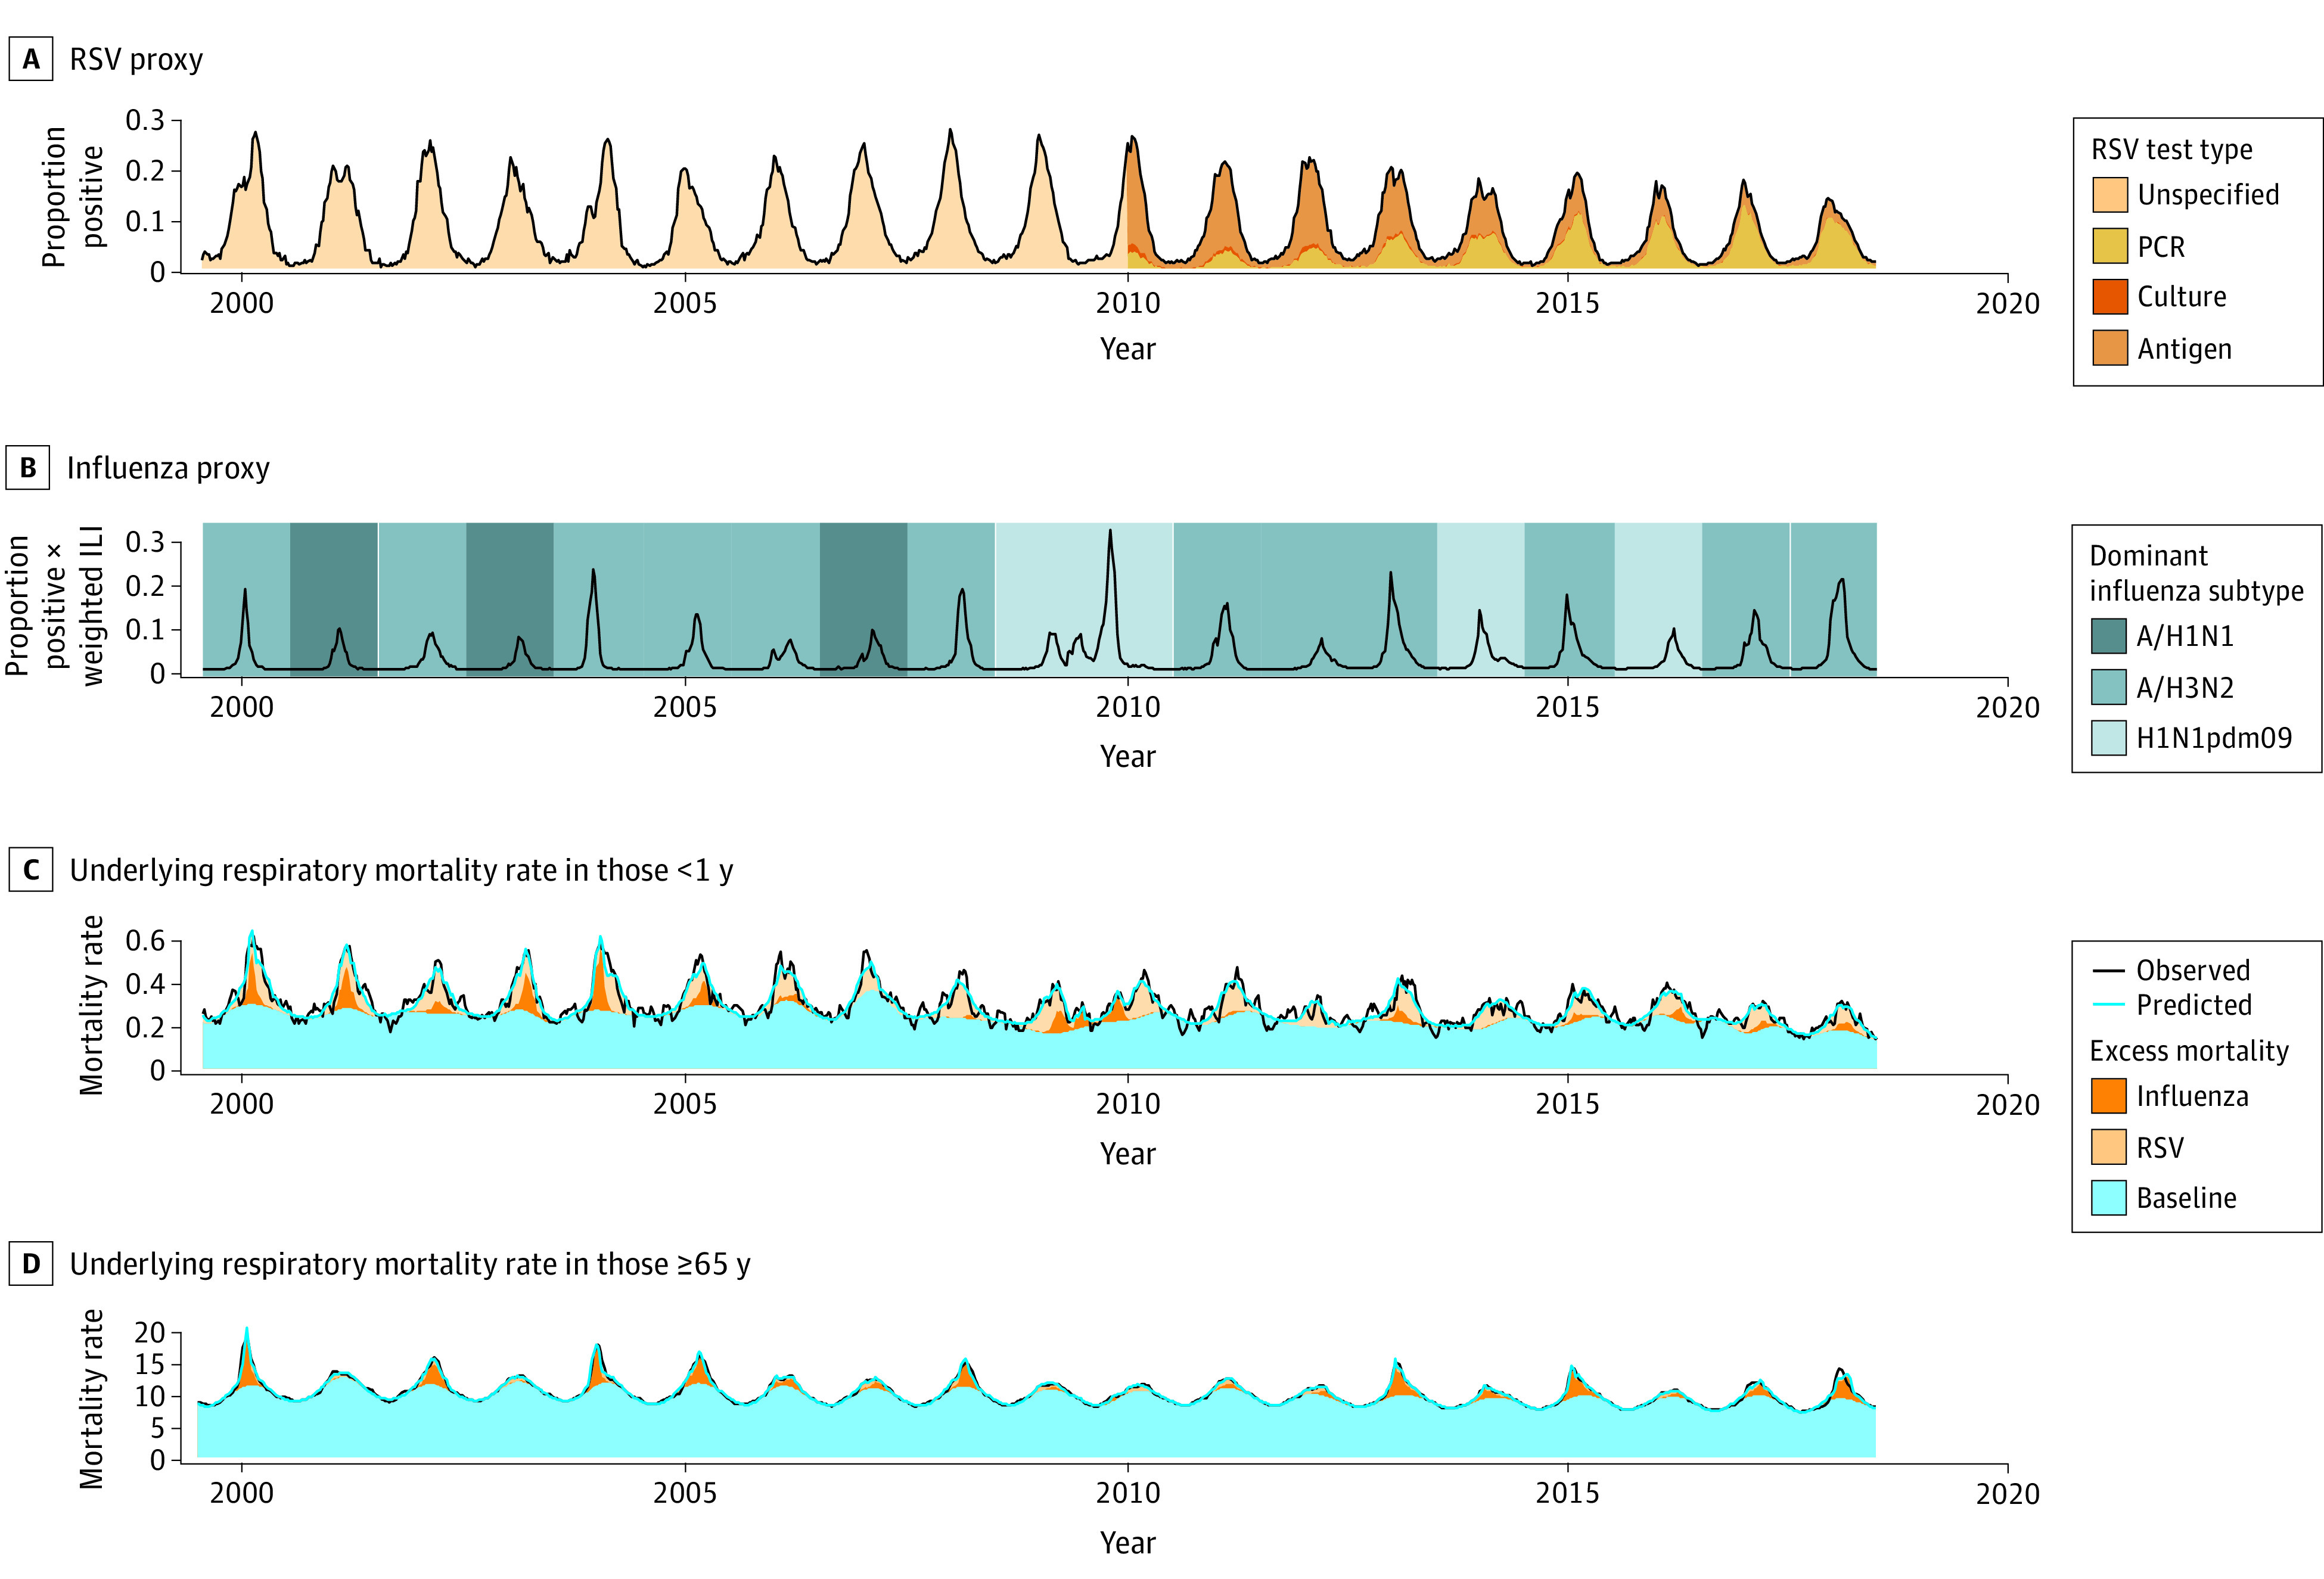
Figure 2. Weekly Time Series for Respiratory Syncytial Virus (RSV) and Influenza Surveillance Proxies and the Underlying Respiratory Mortality Rate per 100 000 Population in Children Younger Than 1 Year and Adults Aged 65 Years or Older.

A, Weekly time series of the proportion of RSV tests with positive results. The different shades of color indicate the type of test used. B, Weekly time series of the proportion of influenza tests with positive results multiplied by weekly, weighted influenza-like illness (ILI) outpatient visits. The different shades of color indicate the dominant influenza A subtype circulating during each season. C, Weekly time series of the underlying respiratory mortality rate for children younger than 1 year (black line), the weekly underlying respiratory mortality rate for children younger than 1 year estimated by the model (blue line), the estimated weekly baseline mortality for children younger than 1 year (blue area), the weekly estimated excess mortality for children younger than 1 year associated by the model with influenza (brown area), and the weekly excess mortality for children younger than 1 year associated by the model with RSV (tan area). D, Same as panel C but for adults aged 65 years or older. PCR indicates polymerase chain reaction.
