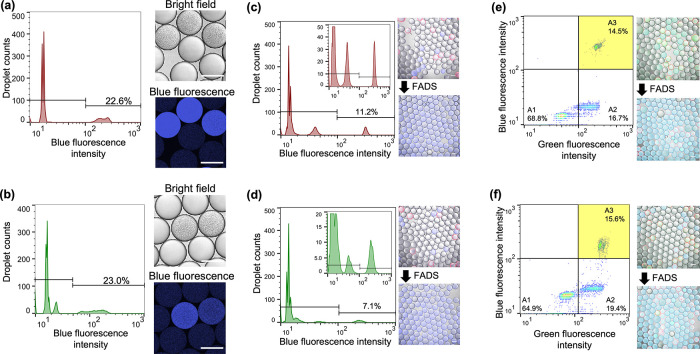
Figure 3.
High-throughput isolation of model microorganisms using (a,c,e) Met–Leu–ACA and (b,d,f) Leu–Asp–ACA. (a,b) Detection of DPP activity of the bacterial cell (P. mexicana WO24) in WODLs. A total of about 3000 droplets were analyzed by FADS. (b,c) High-throughput sorting of model microorganisms, P. mexicana WO24 (DPP-producing) and E. coli (DPP nonproducing). E. coli expressed RFP. A total of about 3000 droplets were analyzed by FADS. Micrographs before merging are shown in Figure S13. (e,f) High-throughput isolation based on DPP activity from suspensions containing two kinds of bacteria, P. mexicana WO24 and E. coli. In the pseudocolor plot of FADS, blue and green correspond to areas of lower cell density, red and orange correspond to areas of high cell density, and yellow corresponds to the mid-range. A total of about 8000 droplets were analyzed by FADS. Micrographs before merging are shown in Figure S14. All scale bars in micrographs represent 100 μm.

