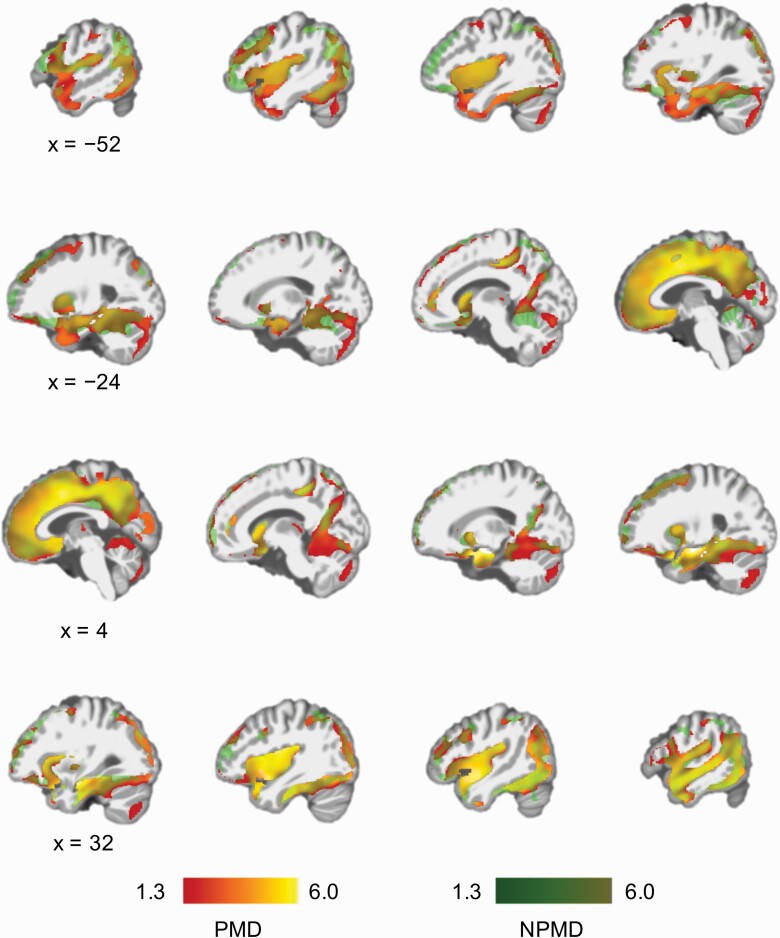
Fig. 2.
Longitudinal effects of ECT on GMV. Results of paired t tests for data at two time points (before and after ECT) in PMD and NPMD. GMV increased in widely distributed brain regions following ECT in both PMD and NPMD. Significance threshold was set at family-wise error-corrected P < .05 determined by threshold-free cluster enhancement. The color bars represent –log(P) (ie, 1.3 is equivalent to “P = .05”). Red represents regional GMV increase following ECT in PMD, and green represents regional GMV increase following ECT in NPMD. Yellow represents overlapped brain regions. Although there seems to be regional GMV increase specific to PMD or NPMD in the figure, there was no significant group-by-time interaction in a flexible factorial model. Abbreviations: ECT, electroconvulsive therapy; GMV, gray matter volume; NPMD, nonpsychotic major depression; PMD, psychotic major depression.

