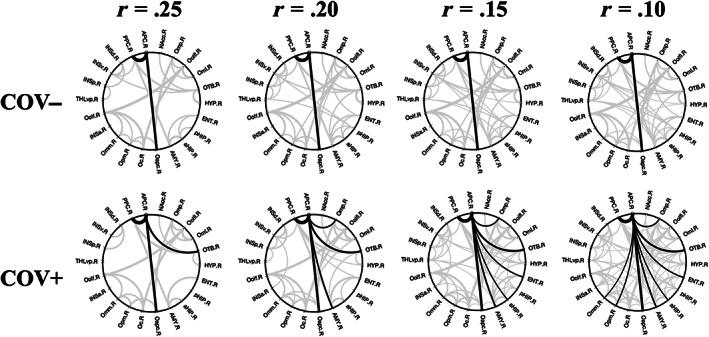
FIGURE 5.

Functional connectivity 2D topology. Circular connectograms for COV− (upper row) and COV+ (lower row) groups at multiple thresholds for the absolute functional connectivity (Pearson r values: r = .25, r = .20, r = .15, r = .10, one‐sample t‐test on z values >0: p <.05, Bonferroni corrected for all possible connections). Supra‐threshold APC connections are traced in black whereas all other connections are traced in gray
