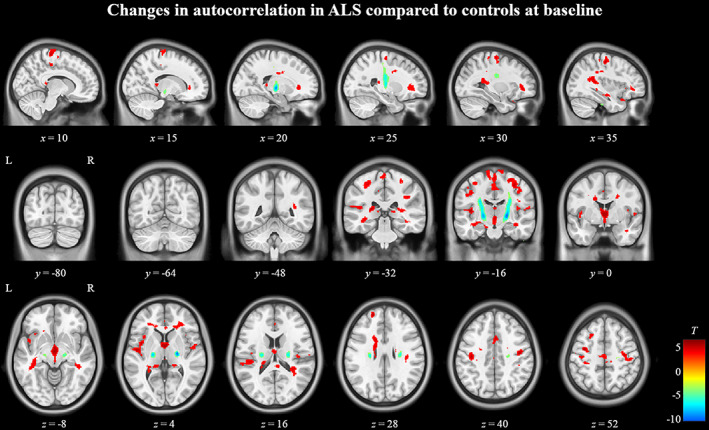
FIGURE 1.

Texture differences between ALS patients and controls at T 0. Regions in red indicate areas of significantly (p < .0005, cluster size >50) decreased autocorrelation in ALS patients and regions in blue indicate areas of significantly increased autocorrelation. The color bar on the bottom right shows the range of T‐values for the contrast controls >ALS patients
