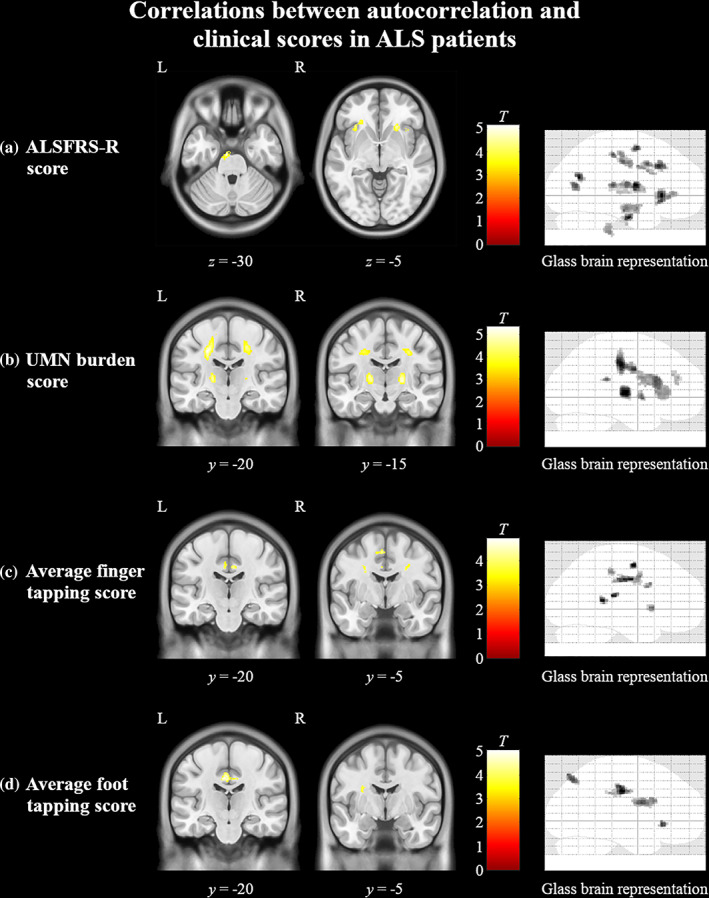
FIGURE 6.

Cerebral associations between texture and clinical measures in ALS patients. Regions in yellow indicate areas of significant (p < .0005, cluster size >50) positive correlations between autocorrelation and (a) ALSFRS‐R, (b) UMN burden score, (c) average finger tapping score, and (d) average foot tapping score. The color bars show the range of T‐values. ALSFRS‐R, ALS functional rate scale‐revised; UMN, upper motor neuron
