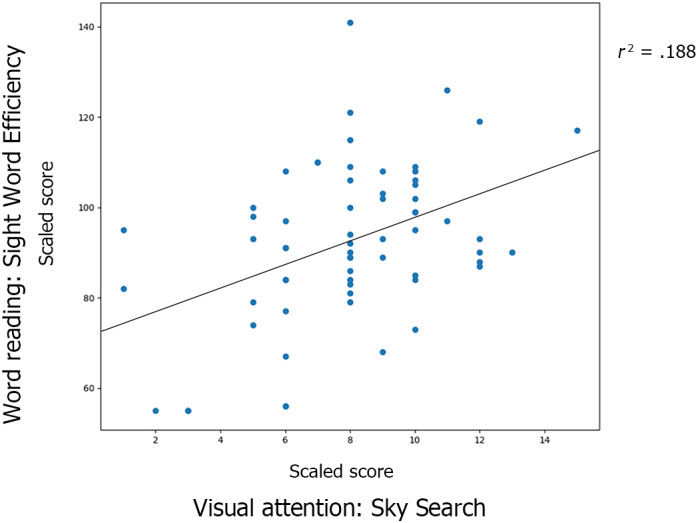
FIGURE 3.

Scatterplot for the correlation between visual attention and word reading in both groups. The Y‐axis represents the scores in single word reading. The X‐axis represents the scores in the administered visual attention task. There was a significant positive correlation between visual attention score and word reading ability when examined across groups (r = .433, p < .001)
