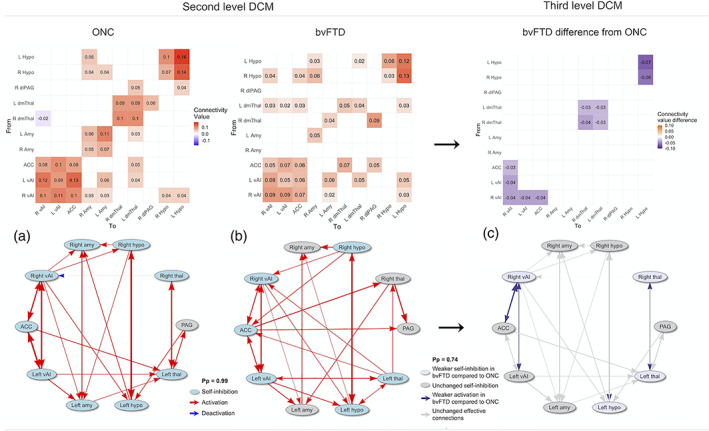
FIGURE 1.

Matrices of mean effective connectivity of the ONC and bvFTD group and bvFTD compared with ONC, accompanied with schematic overviews of the effective connectivity results (thickness of lines equal the effective connectivity strength between node pairs). (a) At a Pp = 0.99, the ONC effective connectivity model shows reciprocal connections among the cortical vAI and ACC nodes. All subcortical bilateral counterparts are reciprocally connected as well. Self‐connections are all self‐inhibiting, except for the PAG. (b) At a Pp = 0.99, the bvFTD effective connectivity model shows reciprocal connections between the cortical SN nodes as well, as well as between the bilateral thalamic nodes. Self‐connections are self‐inhibiting in the bilateral hypothalamic nodes, the left thalamic node, the right vAI, and in the ACC, but are not significantly different in bilateral amygdala, right thalamus, and PAG. (c) The effective connectivity model of the bvFTD group compared with the effective connectivity model of the ONC group showed that at a Pp = .74 there was significantly weaker activation for the bvFTD group among (right) cortical nodes and subcortically between the bilateral thalamic nodes. Effective connectivity from the right to the left hypothalamus was significantly lower as well, and self‐connections were less self‐inhibiting in the right vAI, left hypothalamus and bilateral thalamic nodes. ACC, anterior cingulate cortex; amy, amygdala; bvFTD, behavioral variant frontotemporal dementia; hypo, hypothalamus; L, left; ONC, older normal controls; PAG, periaqueductal gray; Pp, posterior probability; R, right; thal, thalamus; vAI, ventral anterior insula
