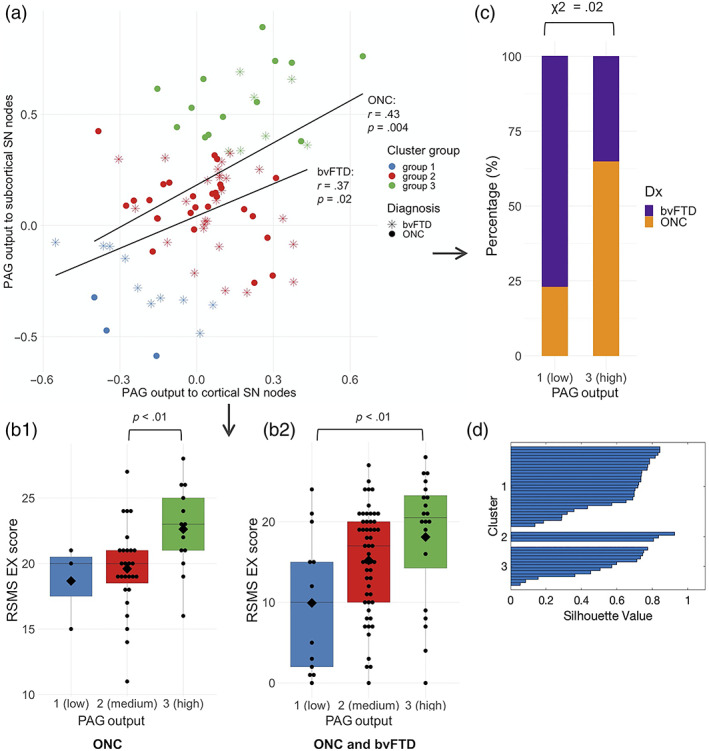
FIGURE 3.

Individual differences in strength of PAG output predict RSMS EX score. (a) Comparing the summary estimates for PAG output to cortical nodes with PAG output to subcortical nodes yielded three different cluster groups in ONCs, of which group 1 (blue) showed weakest PAG output strength toward cortical and subcortical SN nodes, group 2 (red) showed medium output strength, and group 3 (green) showed most output strength toward cortical and subcortical SN nodes. (b1) When comparing RSMS EX scores of ONCs that belong to cluster group 3 (high PAG output) to cluster group 2 (medium PAG output), cluster group 3 performed significantly better on the RSMS EX scale than group 2. (b2) When comparing RSMS EX scores of the whole sample (i.e., ONCs and bvFTD patients combined), members of cluster group 3 performed significantly higher on the RSMS EX scale than members of cluster group 1. This suggests that stronger PAG output (toward cortical and subcortical SN nodes) increased socioemotional sensitivity, both in disease and in normal brain function. (c) By taking the χ 2 of cluster group membership per diagnostic group, bvFTD patients belonged significantly more to cluster group 1, and ONCs belonged significantly more to cluster group 3. This shows that compared with ONC, bvFTD patients belonged significantly more to the cluster group with weak PAG output and corresponding low RSMS EX scores. (d) Middle to high values on the silhouette plot shows that data can be safely divided into three clusters
