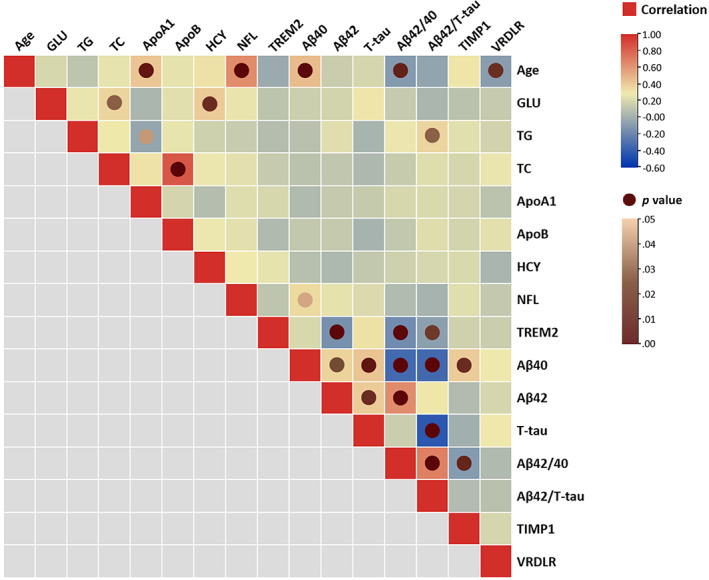
FIGURE 2.

Correlations between concentrations of blood parameters and chronological age. The squares colored with gradient color from red to blue were for Spearman's rank correlation coefficients, and circle nodes with light brown to dark brown were for p value with significance. GMV, gray matter volume
