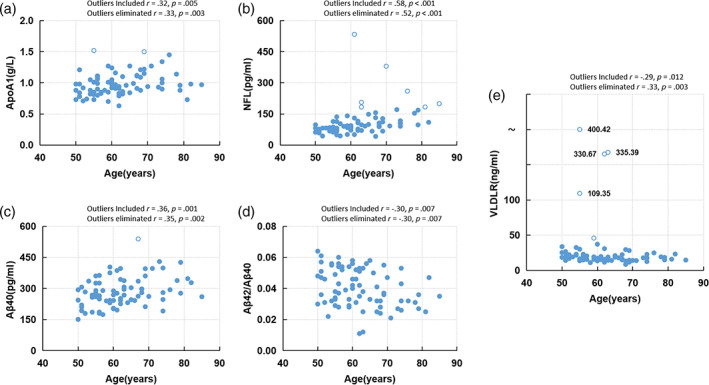
FIGURE 3.

Scatterplots of age‐associated blood parameters over chronological age. The concentrations of (a) ApoA1, (b) NFL, (c) Aβ 40, (d) Aβ 42/40, (e) VLDLR. Outliers are denoted by hollow circles. (r = Spearman's rank correlation coefficient, p = two‐sided p value)
