FIGURE 5.

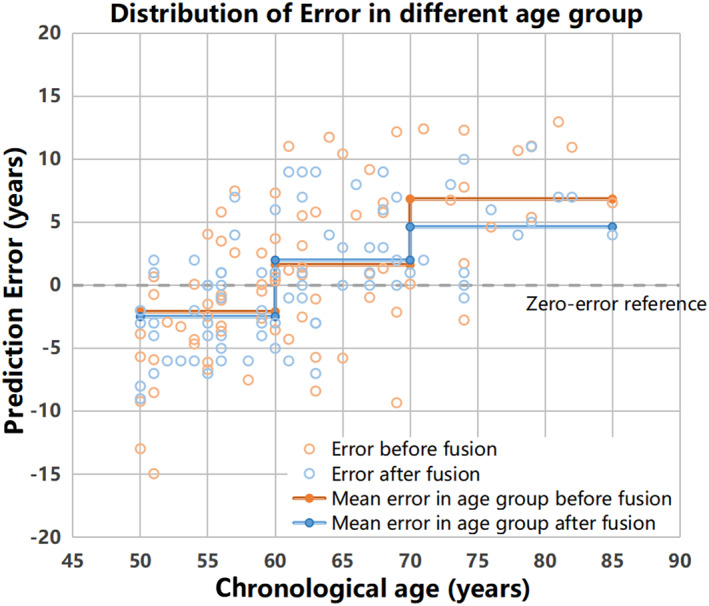
Distribution of age prediction error in different age groups. Each step colored in orange (before fusion) or blue (after fusion) line indicated the mean error in that age group. The gray dashed line indicates the zero‐error reference

Distribution of age prediction error in different age groups. Each step colored in orange (before fusion) or blue (after fusion) line indicated the mean error in that age group. The gray dashed line indicates the zero‐error reference