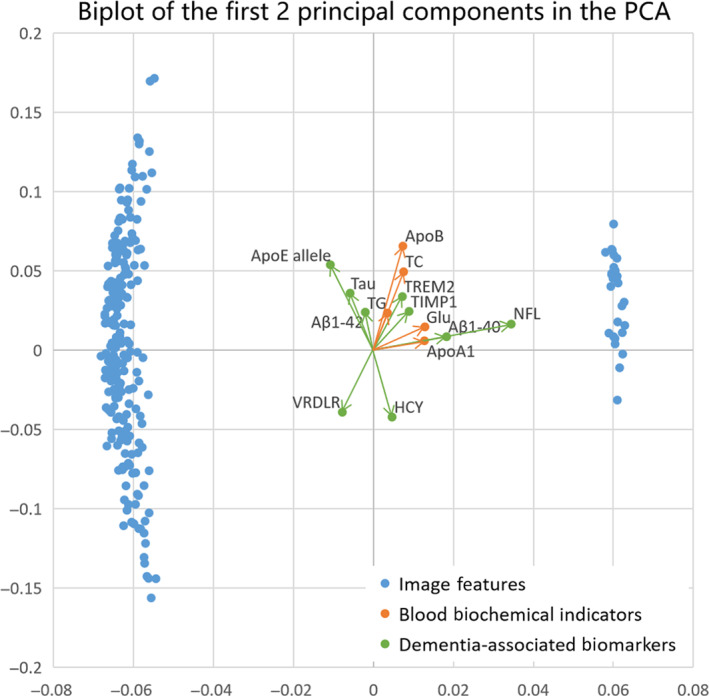
FIGURE 9.

Principal component analysis (PCA). Biplot of the first two principal components in the PCA, accounting for the greatest variance, with blood parameters (including five blood biochemical indicators and nine dementia‐associated biomarkers) labeled. Arrows showed the contribution of original variables to the principal components
