
Fig. A1.
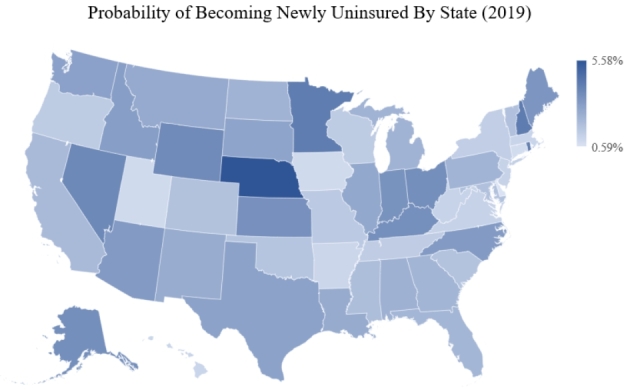
Probability of Becoming Newly Uninsured by State (2019). (Source: Current Population Survey ASEC, 2019; Notes: Sample includes adults aged 19 to 64 with household income between 138 and 400% of the poverty level (N = 214,821). Figure displays probability of becoming newly uninsured in 2019, separately for each state. Estimates are weighted by CPS ASEC sampling weights.)