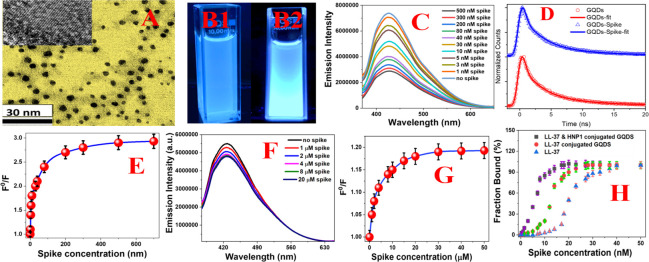
Figure 2.
(A) TEM image of freshly prepared peptide-conjugated GQDs. The high-resolution TEM image in the inset demonstrates the crystal lattice fringe for peptide-conjugated GQDs. (B) Photograph showing the fluorescence image from HNP1 and LL-37 peptide-conjugated GQDs in the presence (B2) and absence (B1) of the SARS-CoV-2 delta variant (B.1.617.2) spike protein. (C) Fluorescence spectra from peptide-conjugated GQDs in the presence of the spike protein at different concentrations. (D) Time-resolved photoluminescence decay curve from peptide-conjugated GQDs in the absence and presence of the spike protein at different concentrations. (E) Plot of log[F0/F] versus log[spike concentration, in nM] for HNP1 and LL-37 peptide-conjugated GQDs, which indicates the nonlinear fluorescence quenching process. (F) Fluorescence spectra from HNP1 human host defense peptide-conjugated GQDs in the presence of the SARS-CoV-2 delta variant (B.1.617.2) spike protein at different concentrations. (G) Plot of log[F0/F] versus log[spike concentration, in μM] for HNP1 peptide-conjugated GQDs, which indicates the nonlinear fluorescence quenching process. (H) Plot showing the binding curve between the peptide-conjugated GQDs and SARS-CoV-2 delta variant (B.1.617.2) spike protein in the ELISA plate-based assay.

