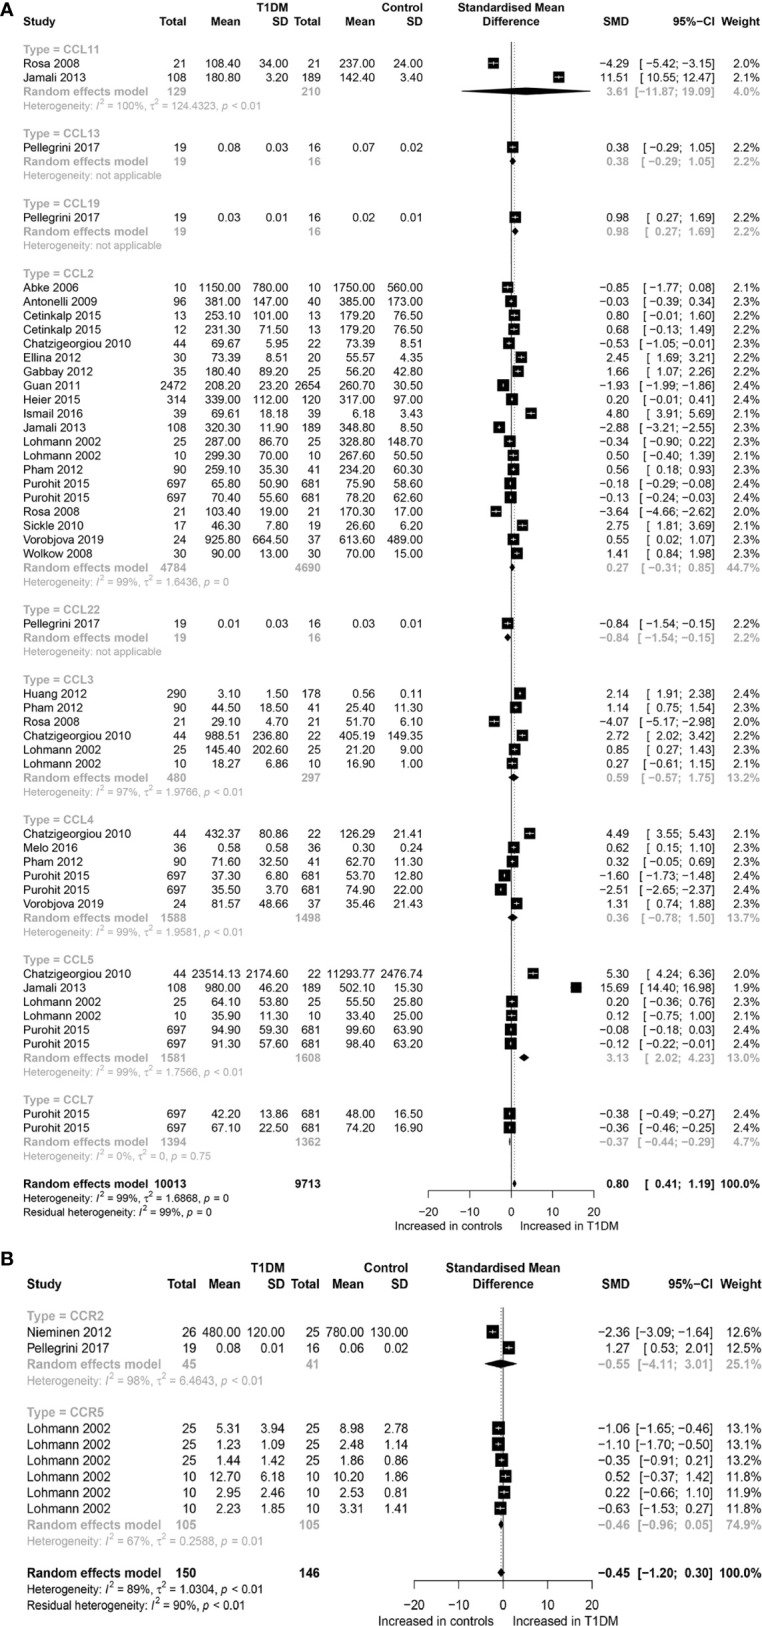
Figure 1.

Forest plot of CC chemokines (A) and CCR (B) between T1DM patients and controls. Study effect sizes of chemokines differences between T1DM and controls. Each data marker represents a study, and the size of the data marker is proportional to the total number of individuals in that study. The summary effect size for each chemokines is denoted by a diamond. T1DM, Type 1 diabetes mellitus; CCR, CC chemokines receptor; SMD, standardized mean difference.
