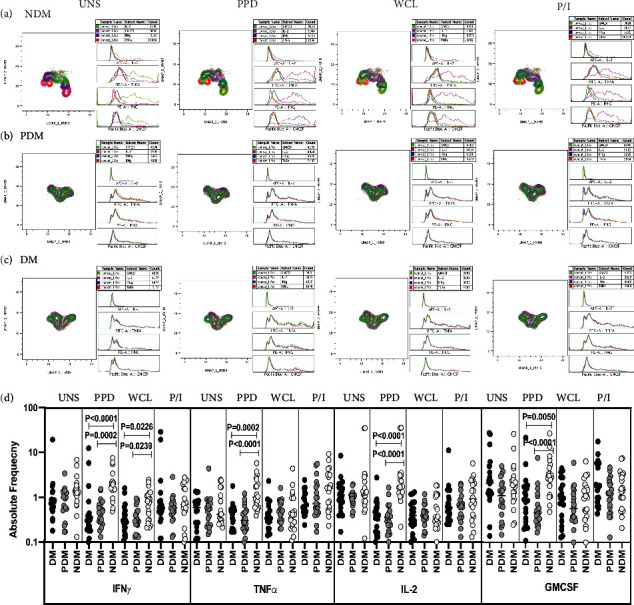
Figure 1.

High dimensionality UMAP analysis of NK cells expressing Type 1 cytokine and GMCSF immune marker. (a) NDM, (b) PDM, and (c) DM expression and histogram profile or dot blot expression of NK cells expressing Type 1 cytokine [TNFα (red), IFNγ (blue), IL-2 (pink)] and GMCSF (green) clusters upon UNS, PPD, WCL antigen, and (mitogen) P/I stimulation. (d) Reduced frequencies of NK cells expressing Type 1 cytokine and GMCSF immune marker in LTB comorbid individuals. Peripheral blood mononuclear cells (PBMCs) was either unstimulated (UNS) or stimulated with Mycobacterium tuberculosis (Mtb) [PPD, WCL] antigens or mitogen for 18 h. The UNS and Mtb antigen-stimulated frequencies of Type 1 (IFNγ, TNFα, and IL-2) cytokines and GMCSF immune marker were examined in LTB DM (n = 20), LTB PDM (n = 20), and LTB NDM (n = 20) individuals. Each black, grey, and silver colour circle indicates a single individual and the bars represent the geometric mean values. Net frequencies were determined by subtracting the UNS from antigen stimulated frequencies for each individual. P values were calculated using the Kruskal-Wallis test with Dunn's multiple comparisons.
