Figure 3.

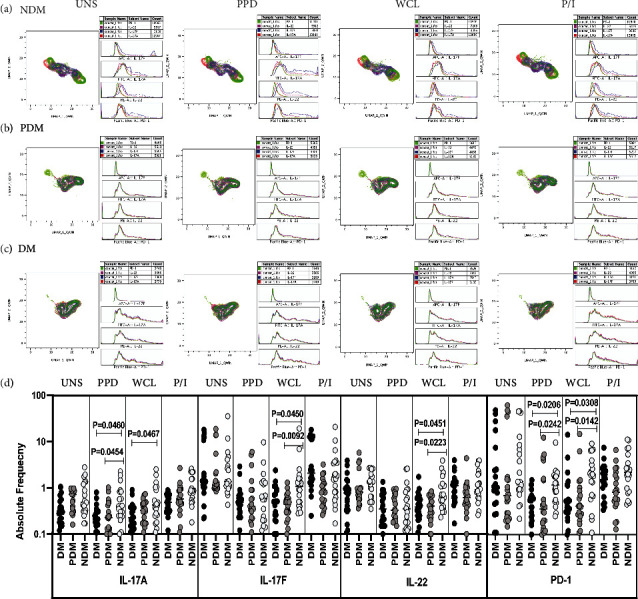
High dimensionality UMAP analysis of NK cells expressing Type 17 cytokines and PD-1 immune marker. (a) NDM, (b) PDM, and (c) DM expression and histogram profile or dot blot expression of NK cells expressing Type 17 cytokines [IL-17A (red), IL-17F (blue), IL-22 (pink)] and PD-1 (green) clusters upon UNS, PPD, WCL, and mitogen antigen stimulation. (d) Reduced frequencies of NK cells expressing Type 17 cytokines and PD-1 immune marker in LTB comorbid individuals. PBMCs were either UNS or stimulated with Mtb [PPD, WCL] or mitogen antigens for 18 h. The UNS and Mtb antigen-stimulated frequencies of Type 1 (IL-17A, IL-17F, and IL-22) cytokines and PD-1 immune were examined in LTB DM (n = 20), LTB PDM (n = 20), and LTB NDM (n = 20) individuals. Each black, grey, and silver colour circle indicates each group, and geometric mean was indicated using bars. The frequencies of net cytokine were determined by subtracting the UNS cytokine frequency from Mtb and mitogen antigen stimulated frequencies. The significant difference was measured using the Kruskal-Wallis test Dunn's multiple comparisons, and they were mentioned using P values.
