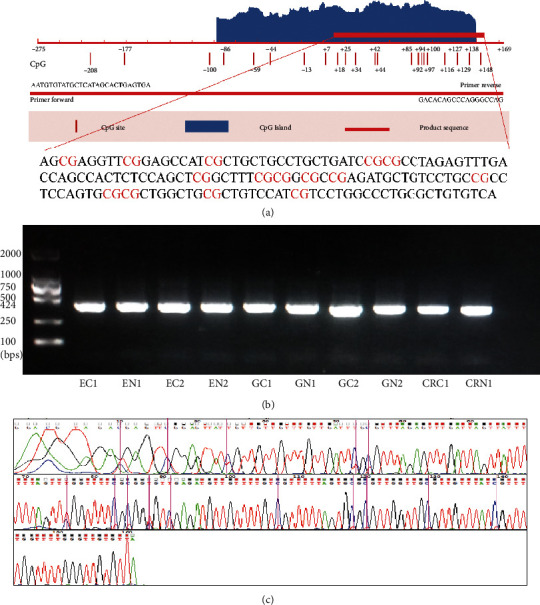
Figure 2.

Amplified sequence of the SST 1stExon and Sanger sequencing results. (a) The amplified sequence was mainly located in the CpG island in SST 1stExon. (b) Agarose gel electrophoresis bands of PCR-amplified products after bisulfite modification. The left lane shows the DNA marker. EC, GC, and CRC represent tumor tissues, and EN, GN, and CRN represent tumor-adjacent noncancerous tissues. (c) The Sanger sequencing results for the PCR products. The purple bars represent the CpG sites. The blue line shows the signal intensity of the methylated C bases, and the red line at the corresponding positions shows the signal intensity of the unmethylated T bases.
