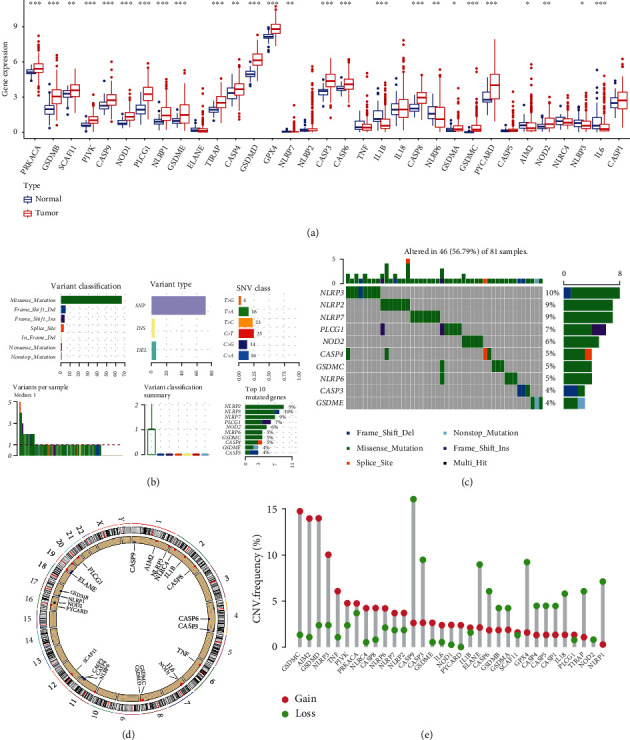
Figure 1.

Landscape of genetic variation and expression of PRGs in LIHC. (a) The mRNA levels of PRGs in LIHC and normal liver tissues. (b, c) The mutation frequency and classification of PRGs in LIHC. (d) The location of CNV alteration of PRGs on 23 chromosomes in LIHC. (e) The CNV variation frequency of PRGs in LIHC. The height of the column represented the alteration frequency. Note: ∗P < 0.05, ∗∗P < 0.01, ∗∗∗P < 0.001.
