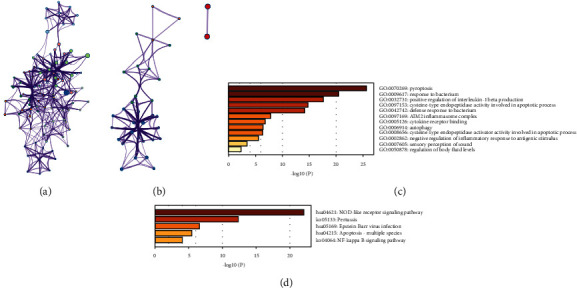
Figure 2.

Functional enrichment analysis of 26 upregulated or downregulated PRGs in LIHC. (a) The relationship network of the 26 PRGs in GO analysis. (b) The relationship network of the 26 PRGs in KEGG pathway analysis. (c) The bar plot of GO analysis, including BP, CC, and MF analysis. (d) The bar plot of KEGG pathway analysis.
