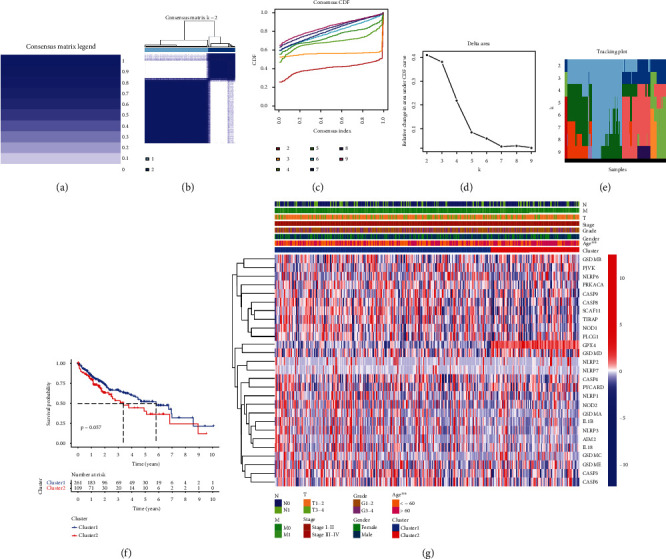
Figure 3.

Consensus cluster analysis of the 26 PRGs in LIHC. The consensus matrix legend (a) and consensus clustering matrix (K = 2) (b) in this consensus cluster analysis. The consensus clustering CDF (c), relative change in area under CDF curve (d), and tracking plot (e) for K = 2 to 9. (f) Comparison of OS plot in cluster 1 and cluster 2. (g) Heatmap revealed the influence of clinical parameters on the expression of cluster 1 and cluster 2. Note: ∗∗P < 0.01.
