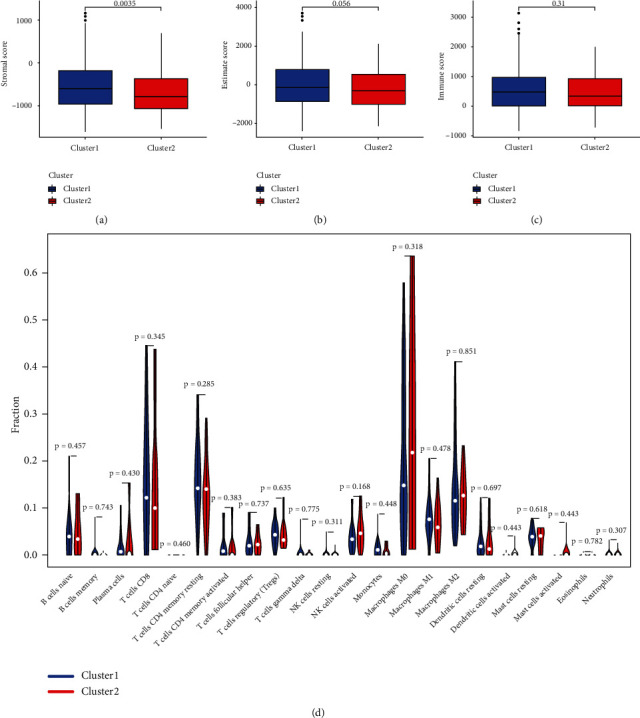
Figure 4.

The correlation between cluster and immune cell infiltration. (a) Cluster 1 had a higher StromalScore than cluster 1. No statistical difference was found in ESTIMATEScore (b) and ImmuneScore (c) between cluster 1 and cluster 2. (d) The infiltrating landscape of 22 immune cells in the two clusters.
