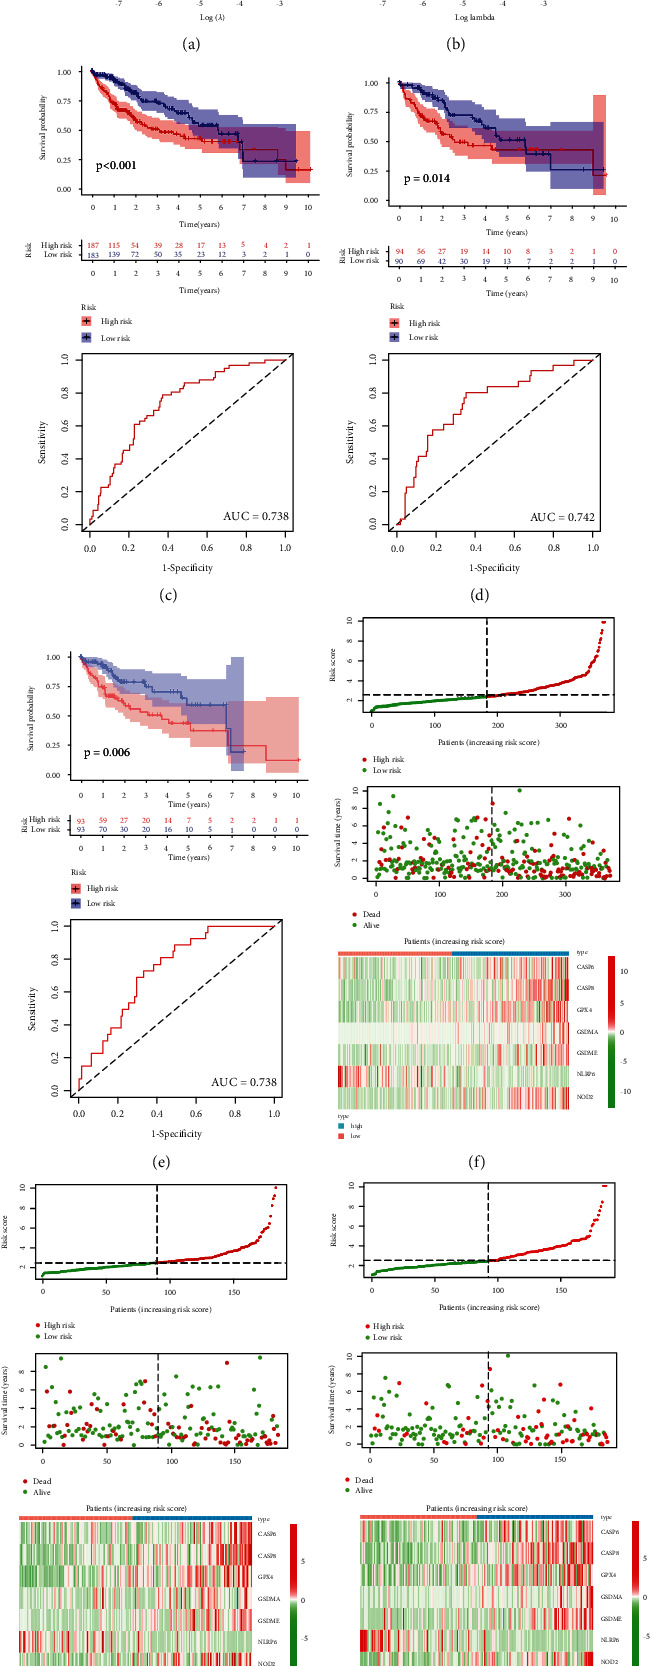
Figure 6.

Prognostic model constructed by the 14 prognostic PRGs. The partial likelihood deviance (a) and coefficients (b) of prognostic model. The OS plots and corresponding ROC curves of high-risk group and low-risk group in all LIHC cohort (c), in test cohort (d), and training cohort (e). Risk score distribution, patients' survival status, and expression of 7 PRGS associated with risk score in all LIHC cohort (f), in test cohort (g), and training cohort (h).
