Figure 8.

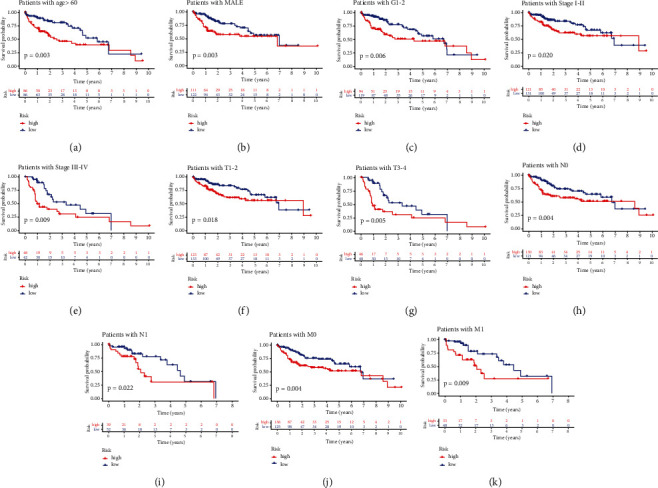
The OS curves of high-risk group and low-risk group based on the subgroups of age (a), gender (b), tumor grade (c), clinical stage (d, e), T stage (f, g), N stage (h, i), and M stage (j, k).

The OS curves of high-risk group and low-risk group based on the subgroups of age (a), gender (b), tumor grade (c), clinical stage (d, e), T stage (f, g), N stage (h, i), and M stage (j, k).