
Figure 9.
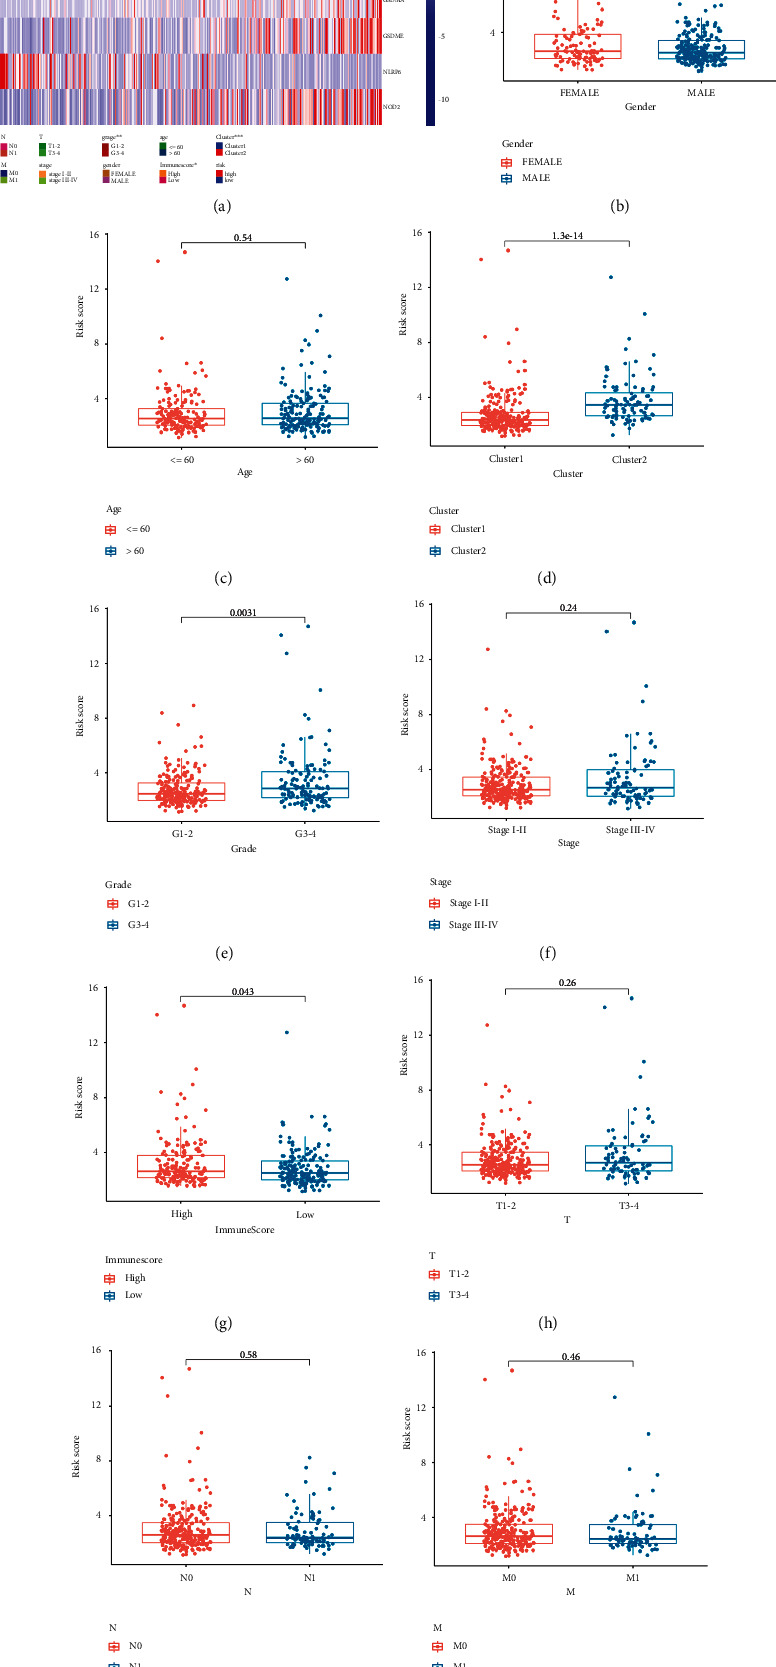
Risk score associated with clinical features in LIHC. (a) The heatmap revealed the difference of clinical characteristics between high-risk group and low-risk group. The difference of risk score in subgroups of gender (b), age (c), cluster (d), tumor grade (e), clinical stage (f), ImmuneScore (g), T stage (h), N stage (i), and M stage (j). Note: ∗P < 0.05, ∗∗P < 0.01, ∗∗∗P < 0.001.