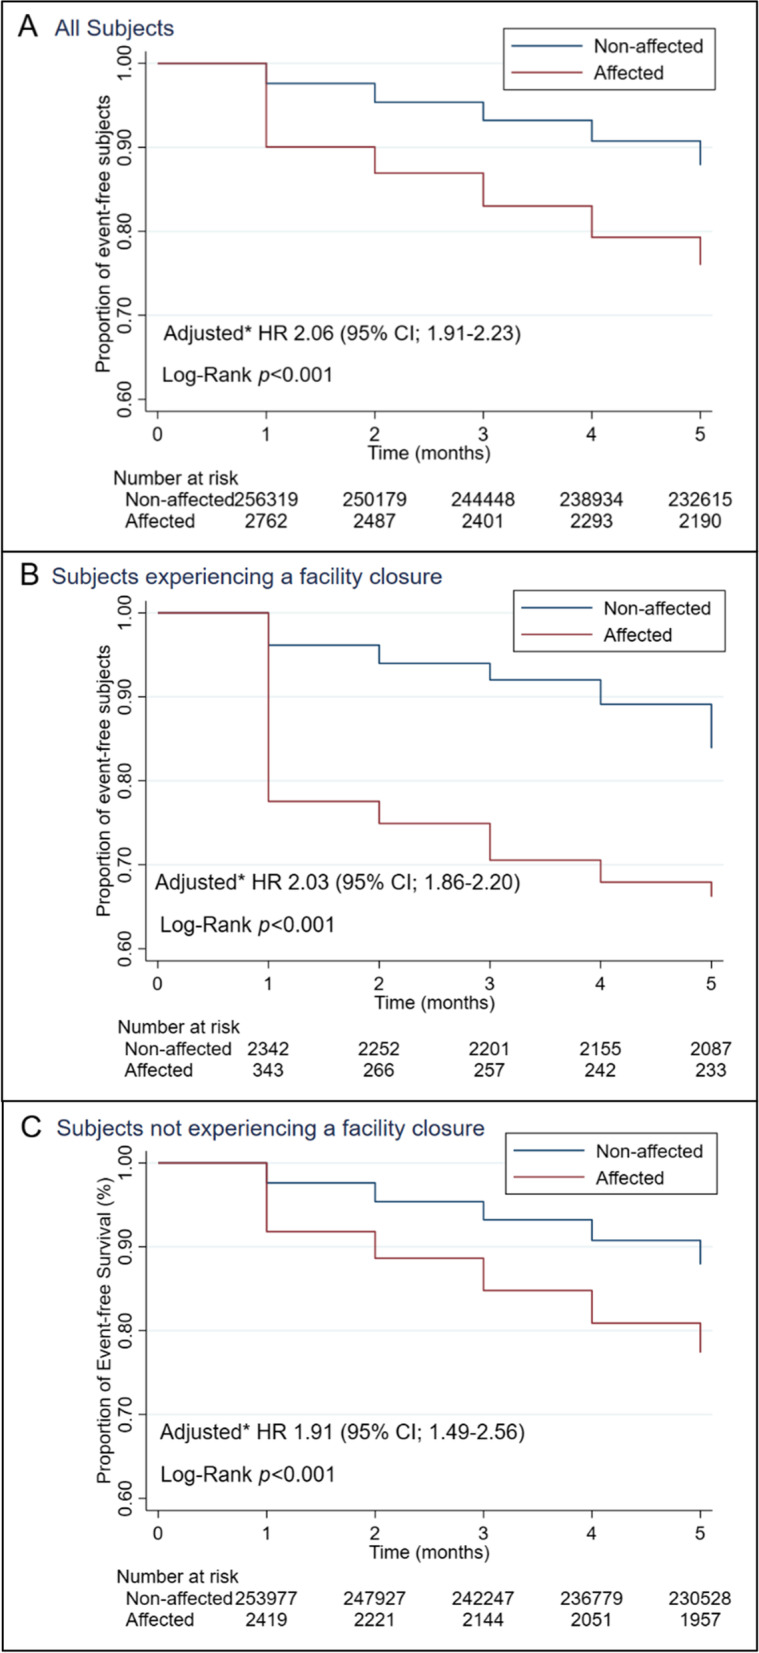
Fig. 2.

Kaplan-Meier Curves for Event-free Survival and Hazard Ratios of Disaster Affected Persons for LTC Discontinuation. Data show event-free rate among disaster affected persons compared with non-affected in all subjects (Panel A), in subjects with facility closure (Panel B) and in subjects without facility closure (Panel C). No interaction was found between disaster-affected persons and closure of associated service facility (p = 0.16). CI, confidence interval; HR, Hazard ratio; *Adjusted for age, sex, level of care needs, type of LTC services in use, facility closure, population density, average income, older people rate of the living place
