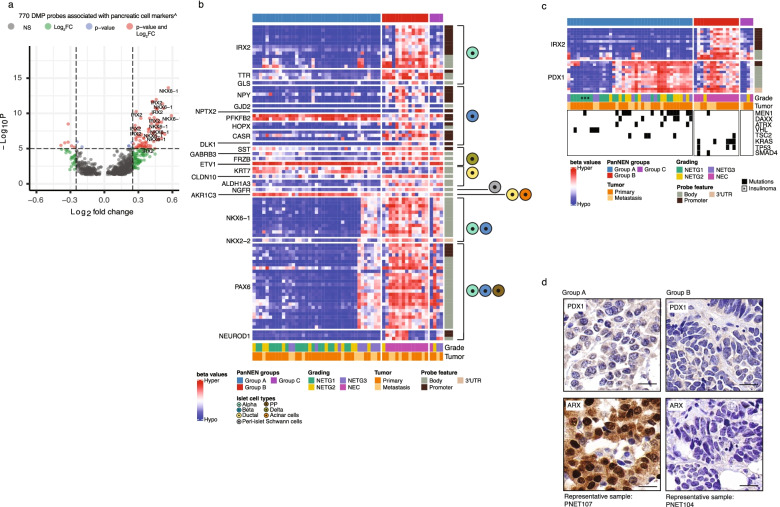
Fig. 3.
Cell marker analysis in PanNEN subgroups identifies endocrine features in Group A. a Differentially methylated probes (DMPs) associated with pancreatic cell markers (n=770 probes). Each point represents a DMP. Dotted line: intersect between -Log10 P value and the log2 fold change (FC) for a given probe. Cut-off for significance: -Log10 P-value > 5 (adjusted p-value: 10−6) and log2FC: >|0.25|. Red: probes passing both cut-offs; green: probes only passing the log2FC threshold; blue: probes with only have a significant p-value; gray: probes that did not pass any of the cut-offs; Significantly associated DMP probes of IRX2 and NKX6-1 are labeled. b Methylation beta value of significant DMPs of pancreatic cell markers. Heatmap displaying the methylation beta values of DMPs (row) in each sample (column). Pancreatic cell-types which the cell marker is associated with, according to PanglaoDB, are displayed on the right. c Methylation beta value of probes associated with IRX2 and PDX1. DMP probes of IRX2 and 10K probes associated with PDX1 (rows) for each sample. Lower panel depicts recurrently mutated genes. d Representative IHC of ARX and PDX1 in PanNEN subgroups. Scale bar: 20μm

