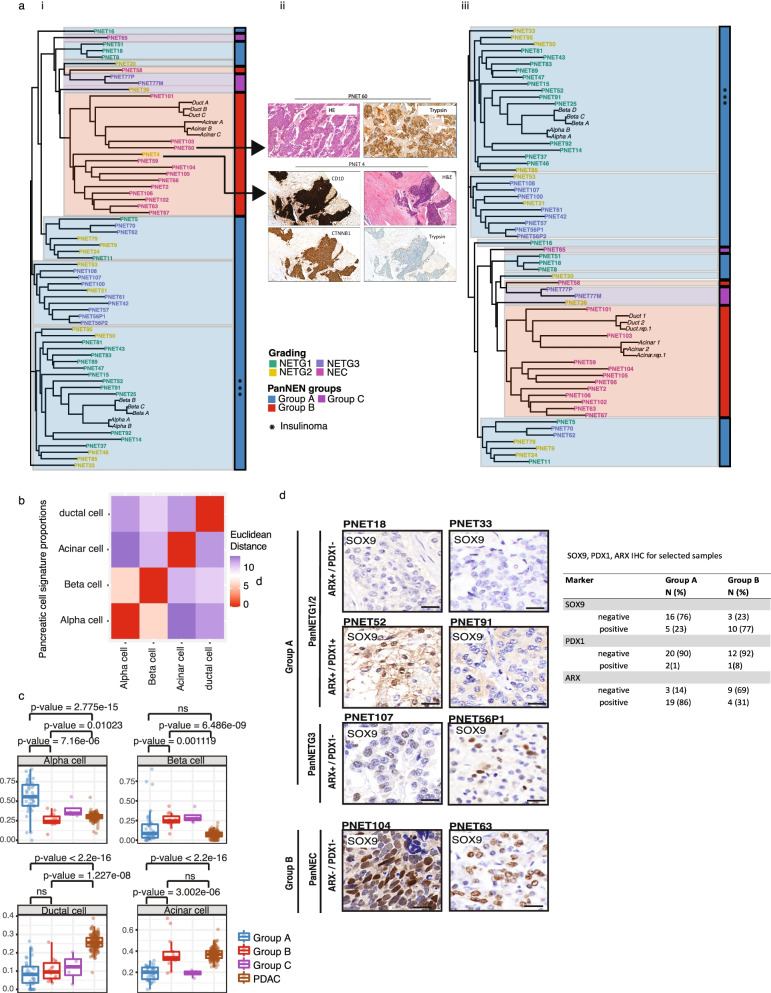
Fig. 4.
Cell-of-origin analysis using normal cell type methylation profiles and SOX9 in PanNEN subgroups indicate exocrine lineage for Group B tumors. a (i) Phylo-epigenetic analysis of PanNEN tumors and normal pancreatic cell types. Pearson distance between the samples computed using differentially methylated CpGs between normal α-, β-, ductal and acinar cells (n = 46,500, adj. p value < 0.01 and |Δβ | > 0.2) and neighbor-joining tree estimation. (ii) IHC of outliers PNET4 and PNET 60, which were re-assessed and removed from phylo-epigenetic analysis (i). (iii) New phylo-epigenetic analysis without PNET4 and PNET60. b Euclidean distance between each cell type was computed and correlation matrix of the distances is displayed. Heatmap depicts the distance between a given normal cell-type pair. c Boxplot representing distribution of the proportion of atlas signatures of α-, β-, ductal and acinar cells (each main box) in the subgroups and PDACs; each dot depicts the proportion of atlas signatures of the respective cell type in a given sample. Two-sample Wilcoxon test. d IHC of SOX9. Representative images for each subgroup; scale bar: 20μm. Table depicts the total IHC score for Group A and Group B samples

