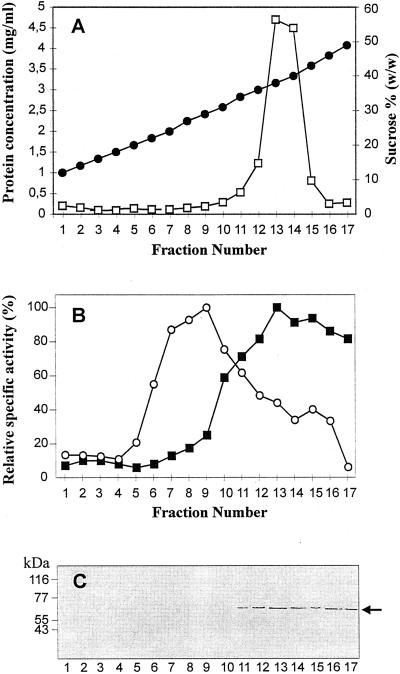
Figure 1.
Subfractionation of cauliflower microsomes by Suc gradient centrifugation. A, Suc concentrations (●) determined by refractometry, and distribution of protein (□) among microsomal subfractions. B, Distribution of ER and vacuolar marker enzyme activities. ○, Bafilomycin A1-sensitive H+-ATPase (100% = 99.4 nmol mg−1 min−1); ▪, antimycin A-insensitive NADH-Cyt c reductase (100% = 59.5 nmol mg−1 min−1). C, Western analysis of microsomal subfractions (10 μg protein per lane) decorated with antibodies against calnexin (1:1,000 diluted). The arrow indicates 65 kD cauliflower calnexin.

