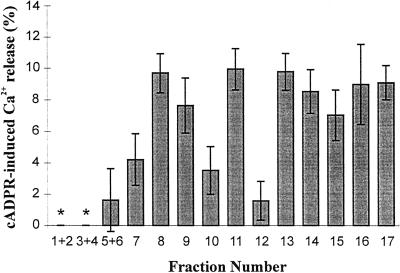
Figure 2.
Distribution of cADPR-induced Ca2+ release among cauliflower microsomal subfractions. Vesicles from each fraction were preloaded with Ca2+ and potential further uptake following Ca2+ release subsequently inhibited as detailed in “Materials and Methods.” An aliquot was removed for radioactivity counting and cADPR (1 μm) was then added. Three aliquots were removed successively over the ensuing 2 min to measure changes in accumulated Ca2+. Results are the means ± se of three to six replicates from two different membrane preparations. Stars indicate non-detectable uptake.

