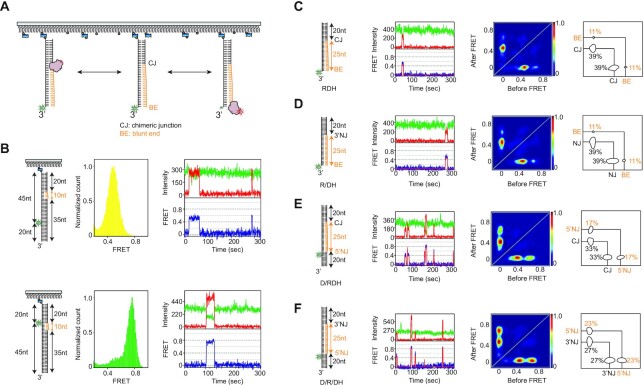
Figure 1.
RNase H recognizes diverse junctions flanking RNA:DNA hybrids, regardless of junctional linkage. (A) Schematic of the smFRET assay to probe binding dynamics. RNase H and hybrid substrates are labeled with Cy5 and Cy3, respectively. (B) Control experiments to assign FRET values using Cy5-labeled RNase H. (top of B) The DNA template strand with the same Cy3 labeling position as shown in C–F was annealed with a 10 nt RNA–20 nt DNA chimeric strand and 35 nt ssDNA, allowing the RNA to act as a single binding site (left cartoon). After Cy5-labeled RNase H was added to the 10 nt RNA region of the hybrid substrate, the FRET value was ∼0.5 (middle, FRET histogram and right, FRET-time trajectory). (bottom of B) When the labeling position was moved close to the RNA region (left cartoon), the FRET value was ∼0.76 (middle, FRET histogram and right, FRET-time trajectory). These control experiments suggested that the binding of RNase H to the Cy3-labeling position of the hybrid substrates used in the main Figures should result in higher FRET, whereas the binding of RNase H to the RNA–DNA chimeric junction should result in lower FRET. (C–F) Structural variants of RNA:DNA hybrids and binding dynamics of RNase H. (First column) The hybrid substrates (cartoon) are named RDH (C), R/DH (D), D/RDH (E), and D/R/DH (F), where R, D, / and H denote RNA, DNA, nick, and hybrid; (second column) example FRET-time trajectory with fluorescence intensity (top, green for donor and red for acceptor) and FRET efficiency with its idealized guideline (blue and red); (third column) transition density plot (TDP) compiled from binding dynamics; and (fourth column) binding and dissociation frequencies (%, next to circles).

