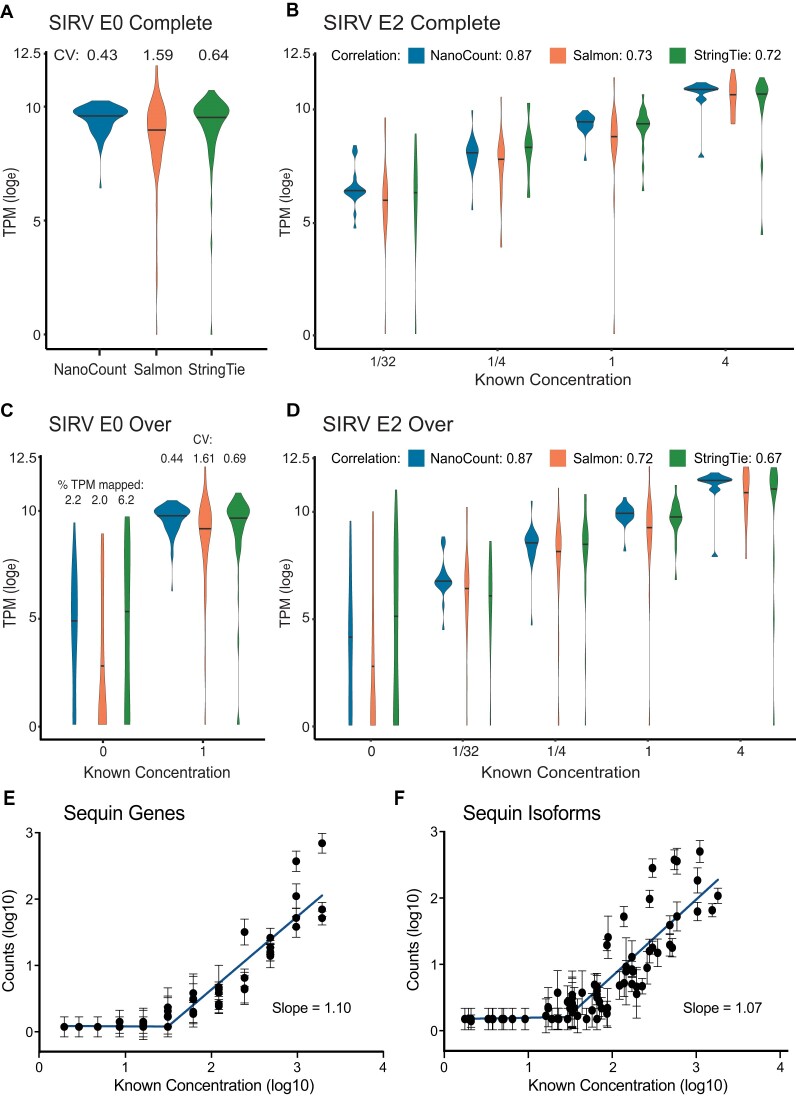
Figure 2.
Comparison of methods for quantifying DRS spike-in controls. (A–D) Comparison of NanoCount, Salmon and StringTie2 for quantification of SIRV spike-in isoform mixes. Median lines plotted. SIRV isoform expression quantified as TPM(loge), i.e.: loge(TPM + 1). (A) SIRV Mix E0 Complete annotation (C) isoforms (coefficient of variation (CV) of TPMs shown). (B) SIRV Mix E2 Complete annotation (C) isoforms (Spearman's r correlation shown). (C) SIRV Mix E0 Over annotation (O) isoforms. TPM coefficient of variation shown for isoforms with a known concentration of 1 fmol. For false positive isoforms with a known count of 0 TPM distribution is plotted and the % of TPMs mapped to 0 count isoforms shown. (D) SIRV Mix E2 Over annotation (O) isoforms (Spearman's r correlation shown). (E, F) Quantification of sequin genes (E) and transcript isoforms (F). Comparison of known sequin Mix B abundance (original concentration in attomoles/ul) to measured counts. Counts and concentrations transformed log10(X + 1). Mean and standard deviation plotted. N = 4. Trend line = segmental linear regression with breakpoint at 1.49 (genes) and 1.44 (transcripts) performed on log10 transformed data.

