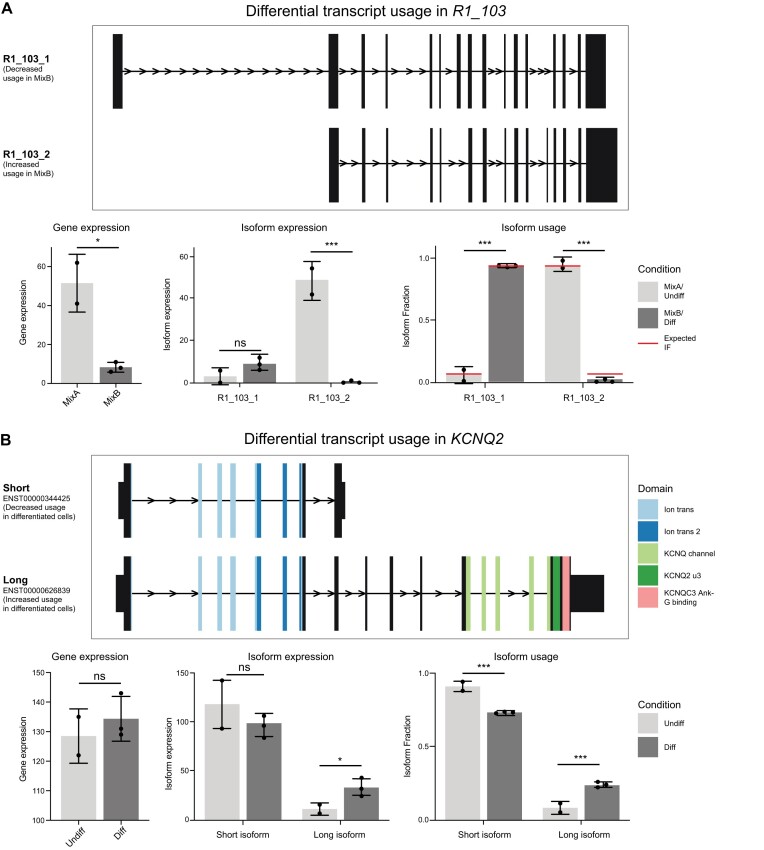
Figure 4.
Differential isoform usage of control and endogenous genes. Identification of DIU in the synthetic sequin gene R1_103 (A) and the potassium channel KCNQ2 (B). Top: structure of expressed isoforms. Arrows show direction of transcription. Narrow lines show intronic regions (not to scale). Exons displayed as boxes. Taller exonic boxes are coding regions, shorter boxes are 5′ and 3′ UTR regions. Colours represent identified protein domains. Below: graphs display gene and isoform expression and the fraction of expression corresponding to each isoform in Mix A/Undifferentiated and Mix B/differentiated samples. Red lines show known (expected) sequin isoform fractions in Mix A and B. ns = not significant, * < 0.05, ** < 0.01, *** < 0.001.

