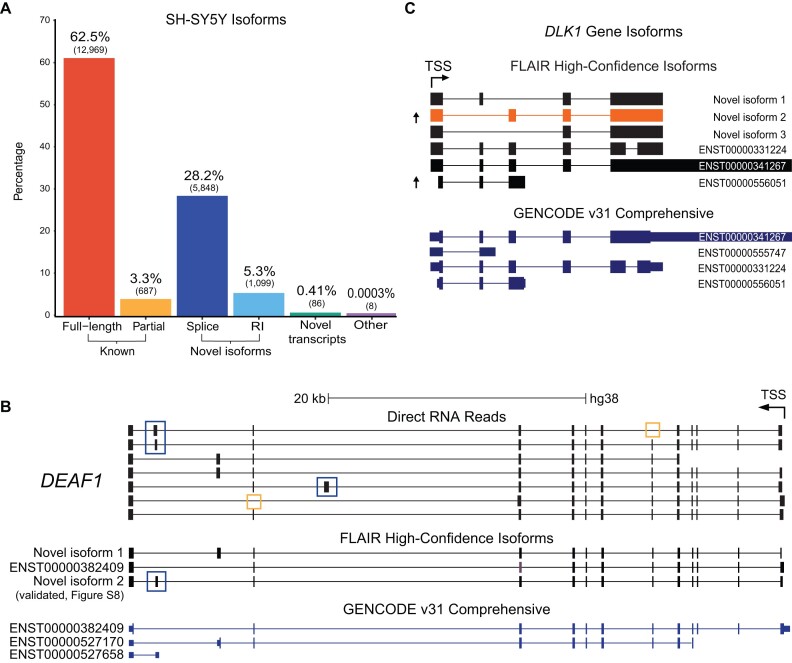
Figure 5.
Identification and quantification of novel isoforms with FLAIR and NanoCount. (A) FLAIR annotation of SH-SY5Y isoforms compared with known annotations using gffcompare (42). The gffcompare class codes were grouped into the following four categories: known, transcripts that are full-length or partial-length exact matches to existing annotations; novel isoform, transcripts from known genes with novel exon junctions or retained introns (RI); novel transcript, novel intergenic, antisense or intronic transcripts potentially representing novel genes; other, possible artifacts and RNA fragments. Number of isoforms in each category shown in brackets. (B) UCSC Genome Browser screenshots of DEAF1 isoforms identified by FLAIR compared to known GENCODE annotations and selected raw nanopore DRS reads. The novel DEAF1 FLAIR isoform validated with a combination of Sanger and ONT PCR-cDNA sequencing is labelled, see Supplementary Figure S8 for validations. Novel exons and exon skipping shown in blue and yellow boxes respectively. (C) UCSC Genome Browser screenshots of DLK1 isoforms identified with FLAIR compared to known GENCODE annotations. Arrows indicate significant differential expression of isoforms upregulated in differentiated samples after quantification with NanoCount. Novel isoform 2 (orange) is the most significant differentially expressed novel isoform and shows a novel 3′ terminal exon and exon skipping. TSS: transcription start site.

