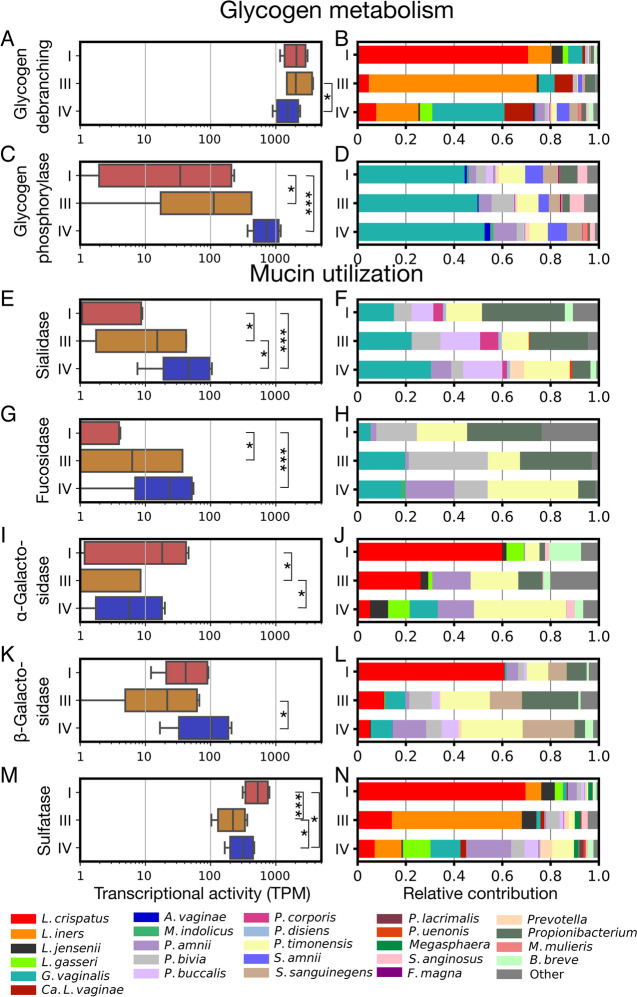
Fig. 6.
Expression of mucin but not glycogen degradation-related genes varied by CST. Differences in the expression of key functions related to the metabolism of glycogen and mucin, two abundant host-derived resources in the vagina. Plots on the left (A, C, E, G, I, K, and M) display the combined transcription of the specified enzymes in log10 transformed transcripts per million (TPM). For each enzyme class, a linear mixed model was used to test for significant differences in its gene expression between CST, with subject included as a random factor. Brackets represent significant post hoc comparisons derived from these models. Plots on the right (B, D, F, H, J, L, and N) display the average relative contribution of various taxa to the transcription of these genes by members of each CST. Longitudinal representations of the expression levels of each enzyme class, for each subject, can be found in Supplementary File 2: Supplementary Fig. 2. *p<0.05; **p<0.01; ***p<0.001

