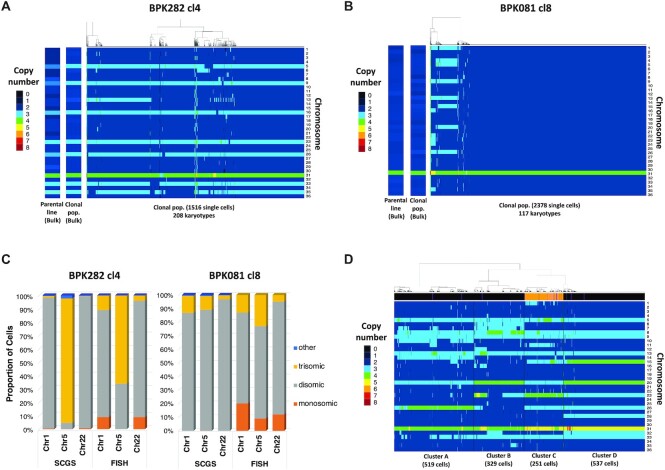
Figure 1.
Mosaic aneuploidy in BPK282 cl4 and BPK081 cl8 clones revealed by SCGS and validation of the method. (A, B) Heat maps displaying the copy number of all 36 chromosomes of promastigotes from BPK282 cl4 (A) or BPK081 cl8 (B) clones (main panels). Each column represents a single parasite. The number of sequenced promastigotes and karyotypes found in each sample is described in the x axis. In each panel, two insets display the average aneuploidy profile (bulk) of the clonal population used in the SCGS and their respective parental strain. (C) Comparison between FISH and SCGS. The proportion of cells displaying monosomy, disomy or trisomy for chromosomes 1, 5 and 22 in each method is represented. Around 200 cells [187–228] were analyzed per chromosome in FISH. (D) Heat map displaying the karyotypes of the promastigotes from four different strains mixed in a single SCGS run. Cells were hierarchically clustered according to their karyotypes, forming 4 major clusters. The number of cells in each cluster is indicated in the x axis. The bar at the top of the heatmap indicate if the SNP profile of the cell corresponds to a BPK strain (black), a HU3 strain (orange) or a doublet (purple).

