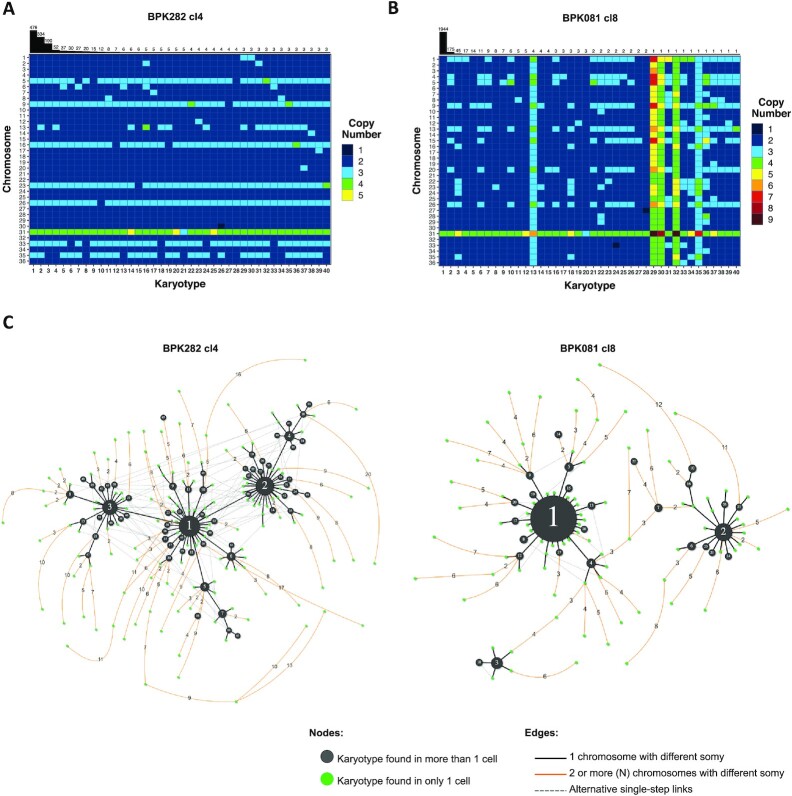
Figure 2.
BPK282 cl4 and BPK081 cl8 display different profiles in the dissimilarity relationship between karyotypes. (A, B) Heat map depicting the 40 most frequent karyotypes in BPK282 cl4 (A) and BPK081 cl8 (B) clones. The bars at the top indicate how many cells are found with each depicted karyotype. (C) Network representing the dissimilarity relationship between karyotypes in each clone. Black nodes represent karyotypes found in more than one cell, with their size proportional to the number of cells. Green nodes indicate karyotypes which occur only once. Black lines link two karyotypes which diverge by a somy difference in a single chromosome, while orange lines link karyotypes diverging by two or more chromosomes with different somy, with the number of divergent chromosomes indicated in the edge. Dashed grey lines show alternative links between karyotypes with a single somy divergency. Polyploid karyotypes were not included in the networks.

