Figure 3.
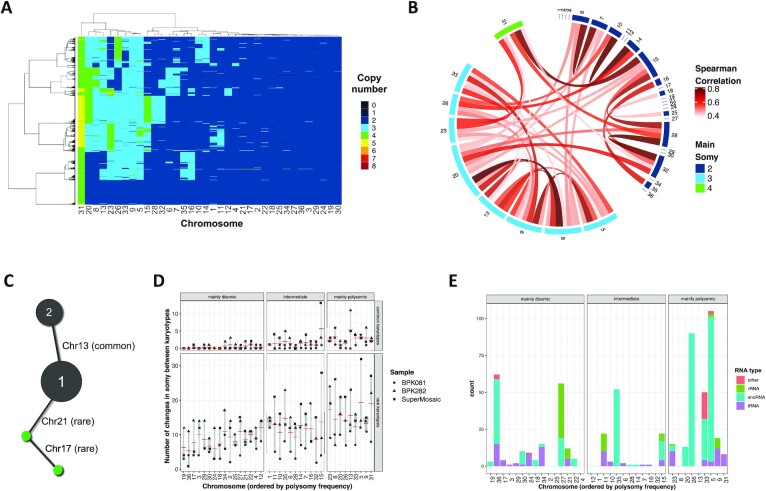
High frequencies of polysomies are restricted to a specific subset of chromosomes. (A) Heat map depicting the copy number of the 36 chromosomes across promastigotes from different clones/strains. Here, 251 promastigotes of each cluster of the mixed sample and from BPK282 cl4 and BPK081 cl8 are represented. Chromosomes are hierarchically clustered based on their somy values. (B) Chord diagrams representing the Spearman correlation between the copy number of all chromosomes. Only correlations higher than 0.4 and with p-value lower than 0.05 are represented. (C) Ilustration of the analysis done based on the karyotype networks of BPK282 cl4, BPK081 cl8 and the super mosaic population in order to quantify changes in somy for each chromosome across different karyotypes. In this image, kar1 and kar2 are found in more than two cells (black nodes), so they are considered common karyotypes. Here, chr13 is the only chromosome that displays a different somy between them, so this is considered as a somy change event for chr13. A second karyotype differs from kar1 by a change in somy in chr21. As this karyotype is found only in one cell, it is considered a rare karyotype. (D) Graph indicating the number of somy change events for each chromosome among the common karyotypes (found in two or more cells – top panel) or the rare karyotypes (found in only one cell - bottom) in the 3 samples submitted to SCGS. Chromosomes are divided in three groups: mainly disomic (found as disomic in more than 95% of the cells), intermediate (found as polysomic in more than 5% of the cells but less than 50%), and the mainly polysomic (found as polysomic in more than 50% of the cells). (E) Distribution of non-coding RNAs across L. donovani genome. Ribosomal RNAs (rRNA), small nucleolar RNAs (snoRNAs) and transporter RNAs (tRNAs) were identified based on the Rfam and TrypDB database.

