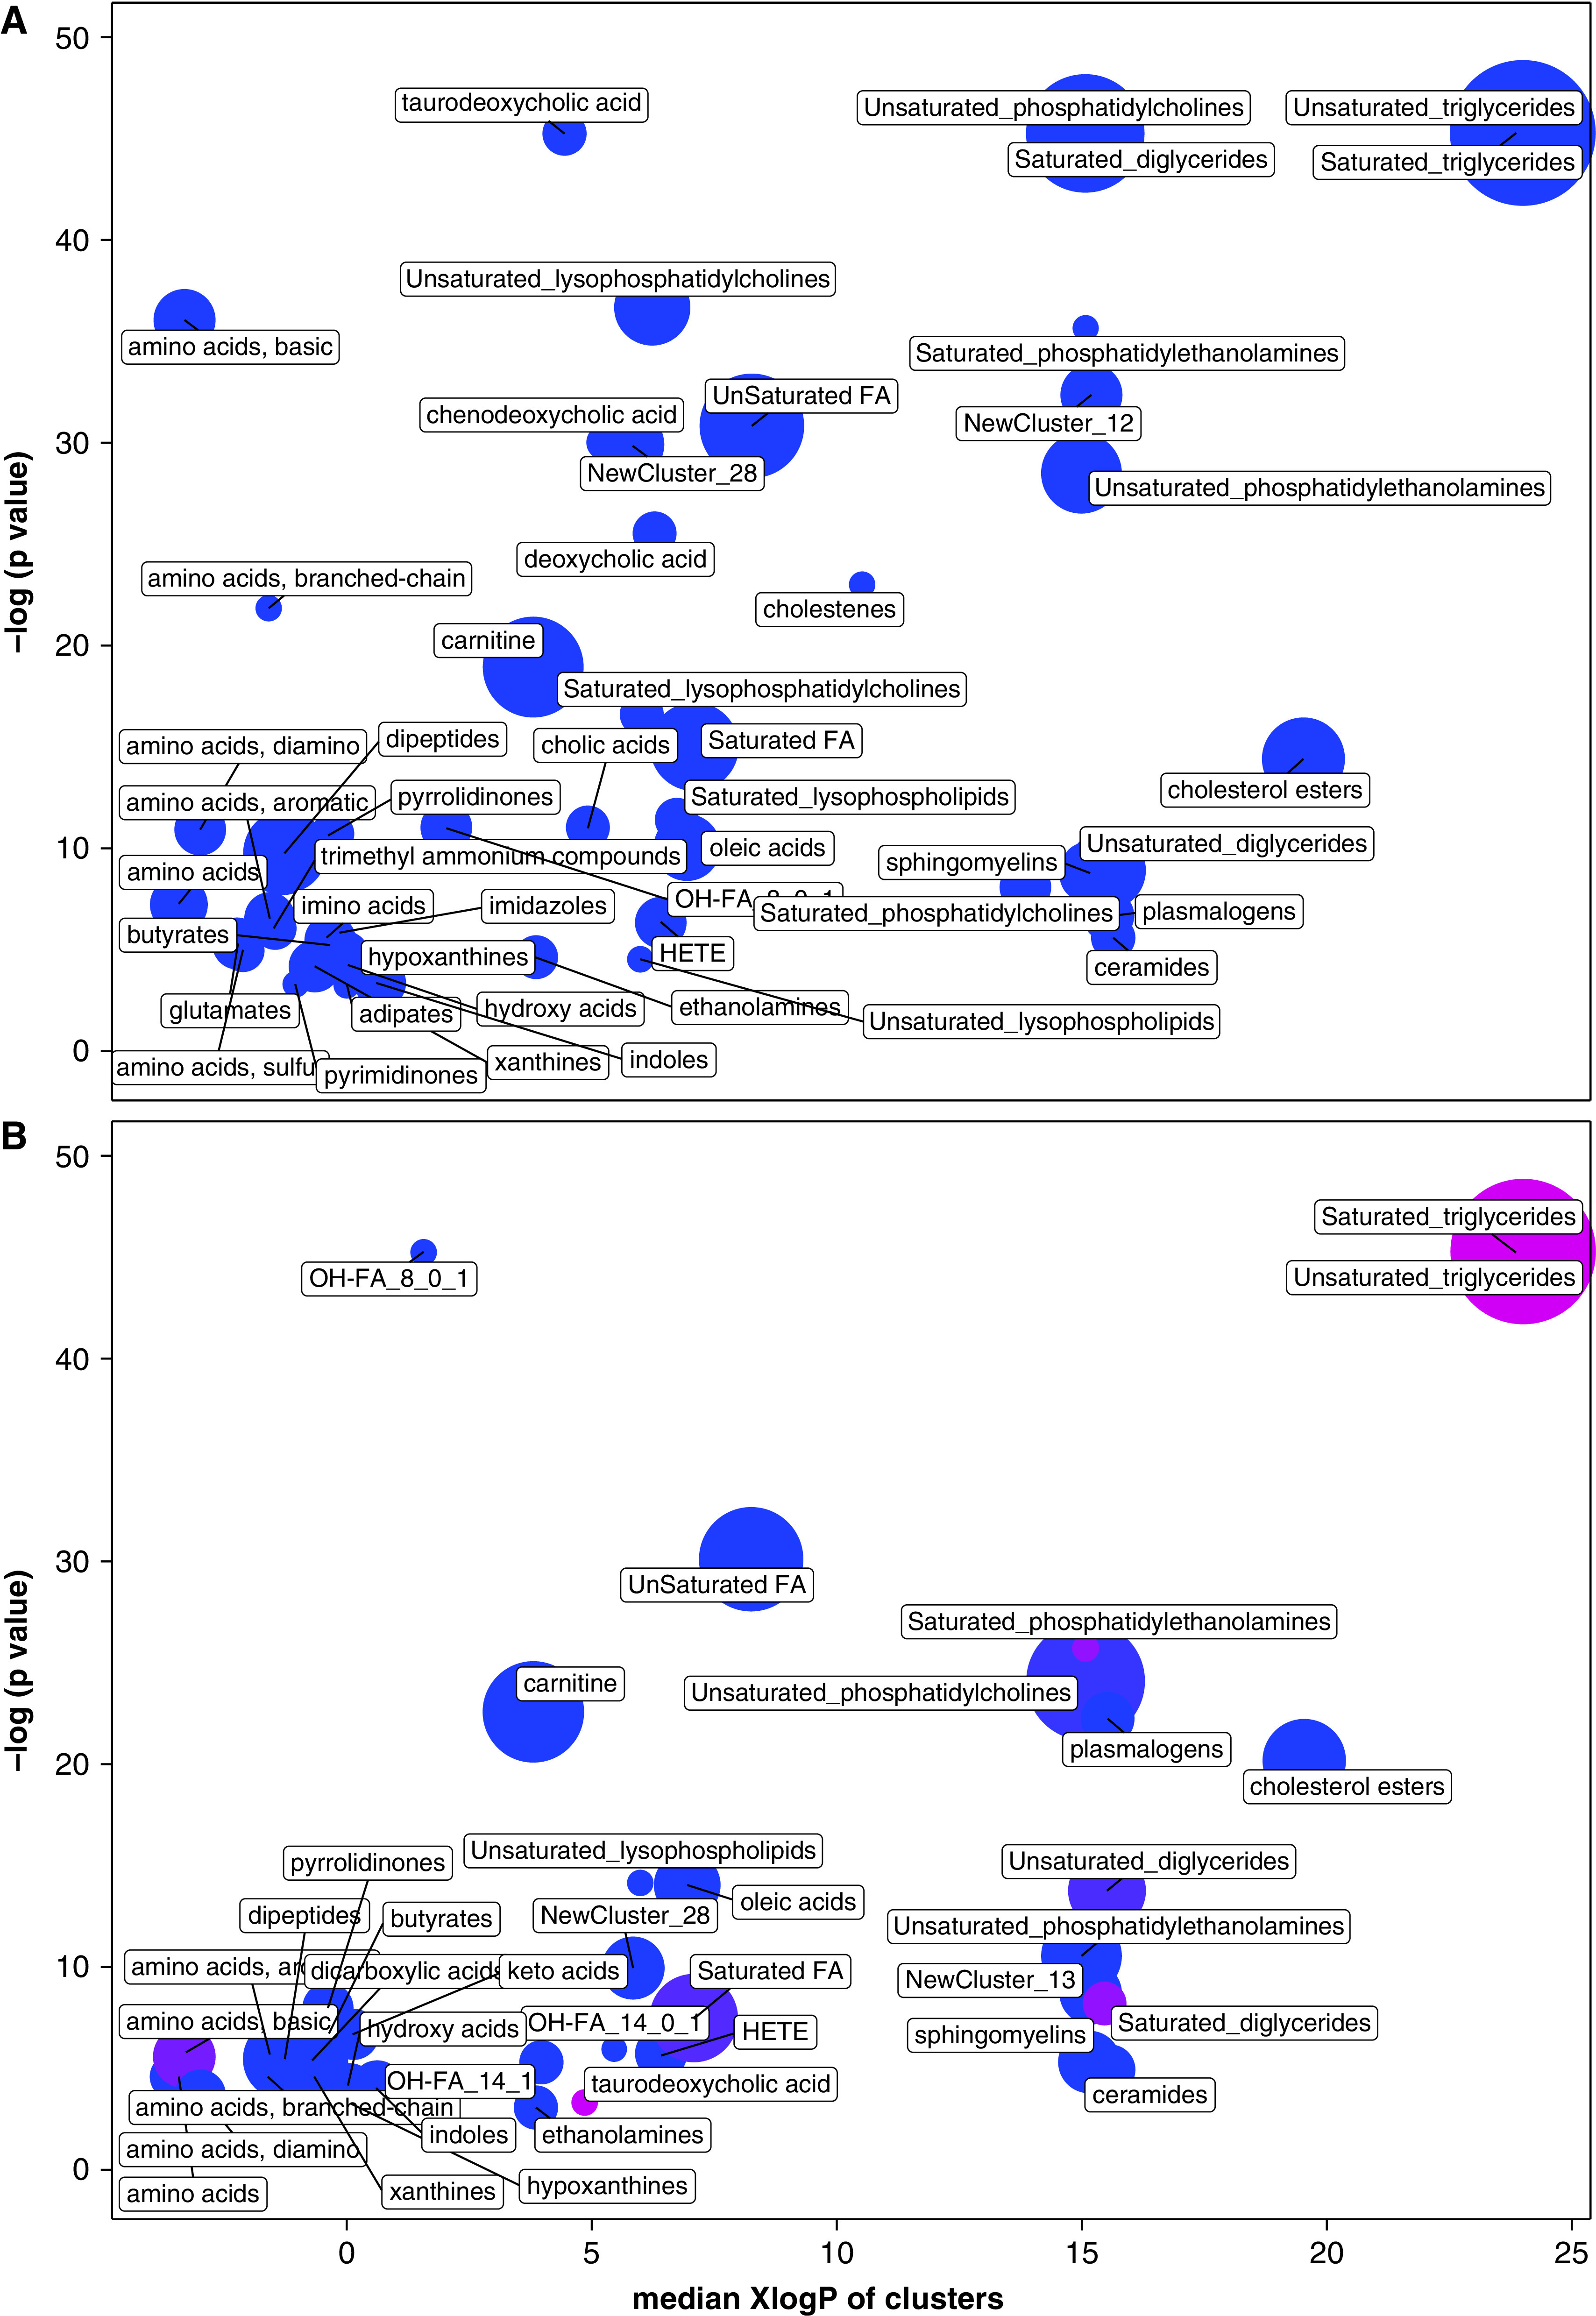
Figure 2.

Chemical similarity enrichment analysis of (A) metabo-endotype 2 membership versus membership in any other metabo-endotype and (B) metabo-endotype 2 membership versus membership in any other metabo-endotype. Figures include all enriched metabolite sets based on false discovery rate < 0.05. Each circle represents a set; circle sizes represent the total number of metabolites in each set. The color corresponds to the proportion of increased (red) or decreased (blue) compounds. Purple circles have both increased and decreased metabolites. The y-axis shows the significance of the enrichment for a given metabolite set. The x-axis shows the median XlogP of clusters, which is a measure of the average lipophilicity of the set, based on the octanol/water partition of the component metabolites. FA = fatty acids; HETE = hydroxyeicosatetraenoic acids; OH-FA = hydroxy-fatty acids.
