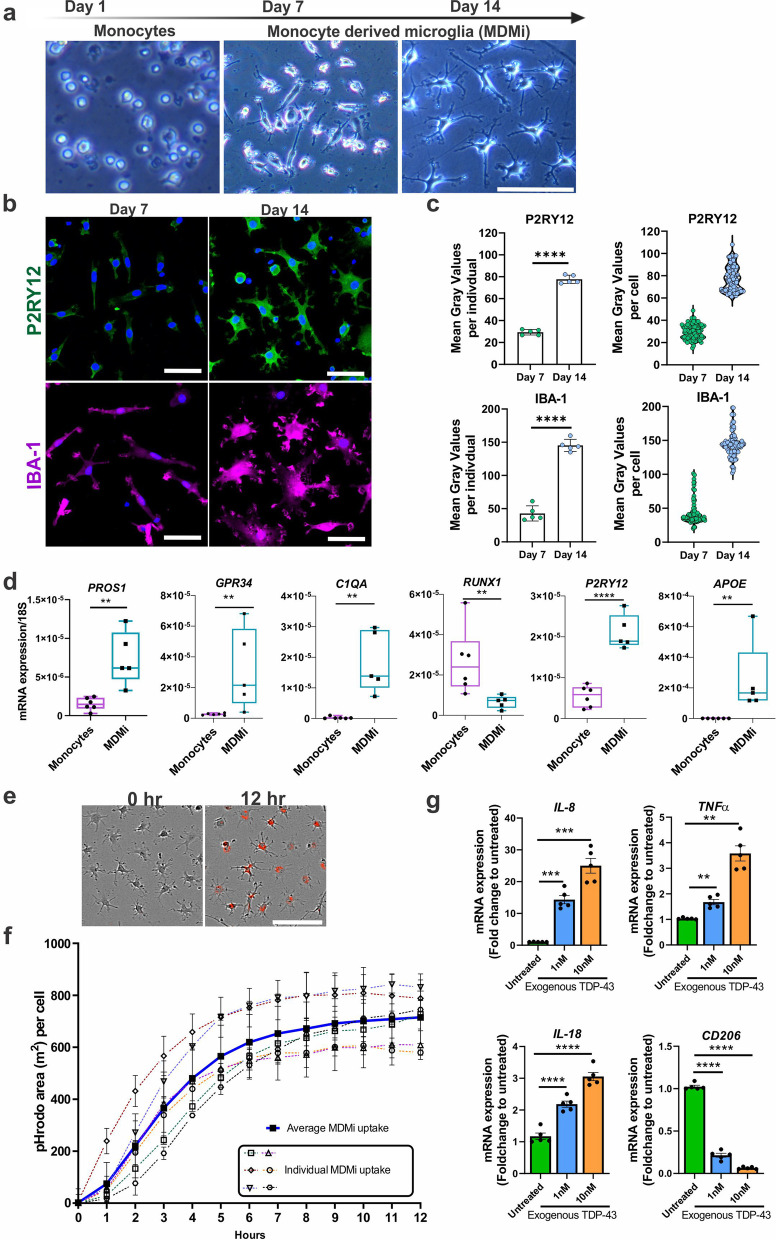
Fig. 1.
Generation and characterisation of human monocyte-derived microglia-like cells (MDMi). a Schematic timeline of MDMi differentiated for 1, 7 and 14 days in culture, with representative phase contrast images. b Immunofluorescence images of P2RY12, IBA1, with counter-stain DAPI in MDMi cultured on Day 7 and Day 14 (n = 5). c MDMi have higher P2RY12 and IBA1 protein levels at Day 14 compared to Day 7 as measured for 5 different individuals (n = 100 cells in total). d Gene expression of seminal microglia genes including PROS1, GPR34, C1QA, RUNX1, P2RY12 and APOE between isolated monocytes (n = 6) and MDMi (Day 14, n = 5). e Representative phase contrast images of day 14 MDMi with pHrodo-labelled E.coli particles (red) uptake at 12 h after treatment compared to untreated (left panel) (n = 6). f Quantification of phagocytosis by pHrodo-labelled E.coli particles over 12 h using live imaging in healthy volunteers (n = 6, dotted lines). Average uptake of MDMi shown in bold line. g Gene expression of MDMi (Day14) treated with 1 nM (blue) and 10 nM (orange) recombinant TDP-43 protein (n = 5). The y-axis represents the fold change of mRNA expression levels (IL-8, TNFα, IL-18 and CD206) normalised to untreated cells over 24 h treatment. Data were first tested for normality using Shapiro–Wilk test. Statistical analysis between two groups was performed using Student’s t test and between multiple groups using one-way ANOVA. Values are the mean ± SD (*P < 0.05, **P < 0.01, ***P < 0.001, ****P < 0.0001). Scale bars = 50 µm

