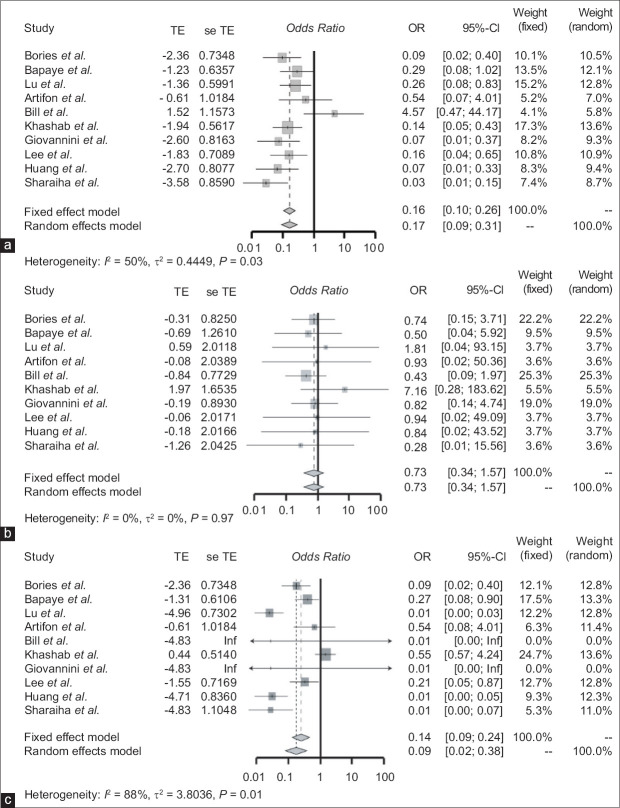
Figure 3.
(a) Forest plot of the odds ratio of studies comparing the acute adverse event of EUS-BD and PTC. (b) Forest plot of odds ratio of studies comparing the chronic or delayed adverse event of EUS-BD and PTC. (c) Forest plot of odds ratio of studies comparing the total adverse events of EUS-BD and PTC. TE: Treatment effect; seTE: Standard error of treatment effect; OR: Odds ratio; CI: Confidence interval; PTC: Percutaneous transhepatic cholangiography; EUS-BD: EUS-biliary drainage

