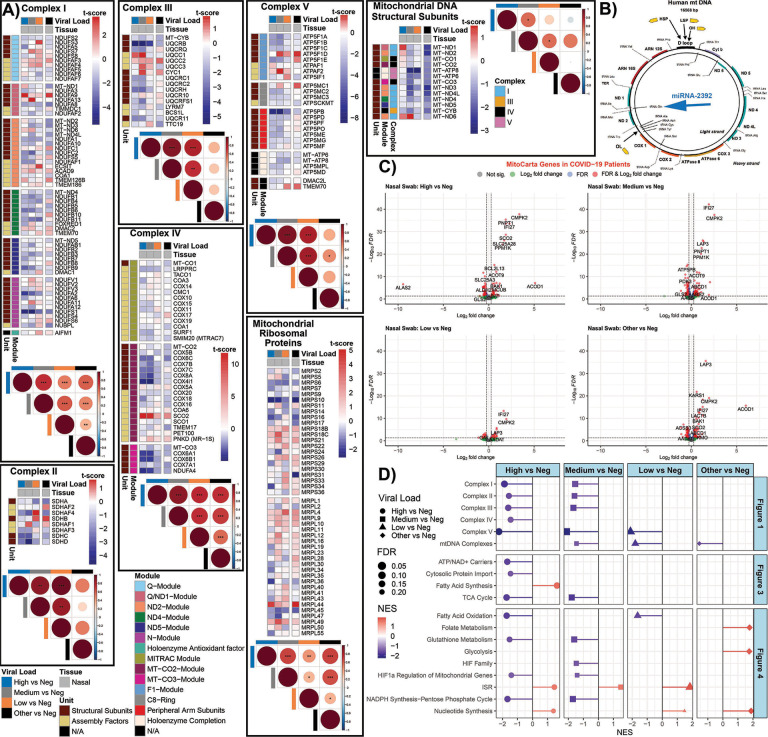
Fig. 1. Mitochondrial OXPHOS complex module gene expression in nasopharyngeal samples from COVID-19 patients.
A) Heatmaps of t-score statistics for specific mitochondrial complex genes expression. Correlation plots associated with each heatmap are shown for all the samples. Circle size is proportional to the correlation coefficient. Two-tailed Student’s t-test *p<0.05, **p<0.01, ***p<0.001. B) Schematic of the human mtDNA with the position that miR-2392 will interact. C) Volcano plots for differentially expressed genes related to mitochondrial processed (MitoCarta). D) Lollipop plots custom-curated mitochondria gene sets determined by fGSEA. NES, nominal enrichment score.

