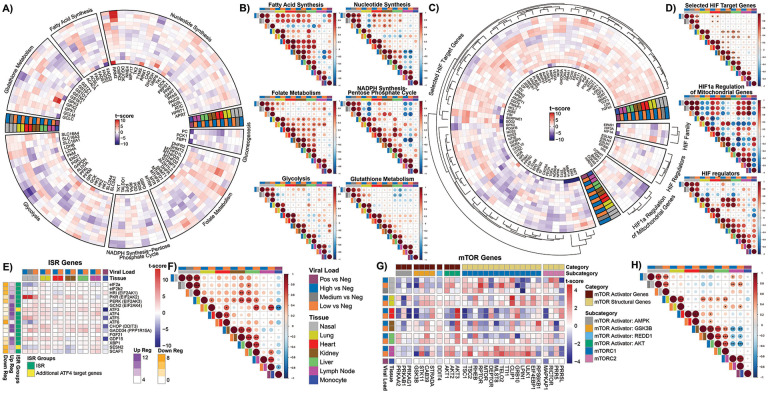
Fig. 4. Glycolysis pathways, HIF pathways, ISR, and mTOR genes show differential expression.
A), C), E), and G) Circular and tabular heatmaps display the t-score statistics when comparing viral load versus negative patient samples for nasopharyngeal swab and autopsy samples for genes related to specific pathways. The outer dendrogram in C) visualizes similar clusters as identified by complete-linkage clustering using Euclidean distance within each segment. B), D), F), and H) Correlation plots associated with each group are shown for all the samples. Circle size is proportional to the correlation coefficient. Statistical significance determined using a two-tailed Student’s t-test *p<0.05, **p<0.01, ***p<0.001.

