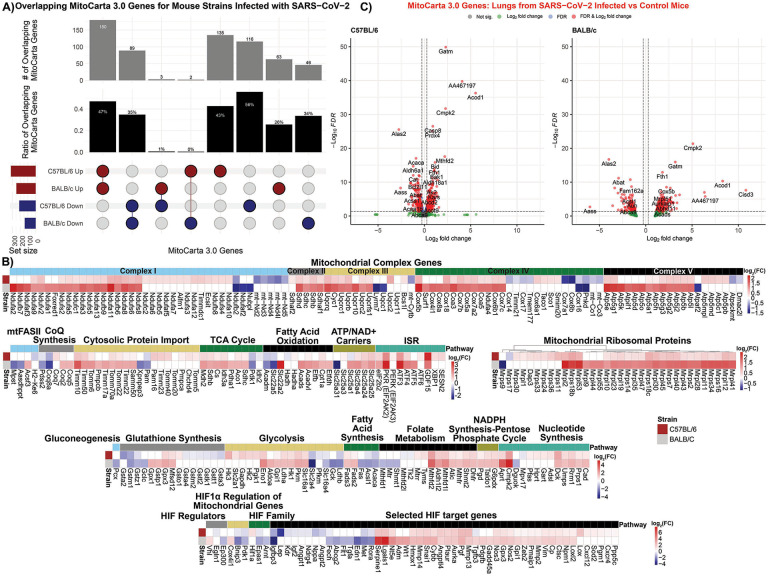
Fig. 7. Mitochondrial specific analysis on RNA-seq data from SARS-CoV-2 infected mouse lungs.
A) Upset plot of the overlapping MitoCarta genes comparing lungs from BALB/c and C57BL/6 mice infected with SARS-CoV-2. B) Heatmaps display of mitochondrial specific genes with t-score statistics comparing SARS-CoV-2 infected mice vs. controls. C) Volcano plots for differential MitoCarta genes from C57BL/6 and BALB/c tissues.

