
Figure 2. Omicron/BA.2 and Omicron/BA.1 show similar infectivity and pathogenicity in hamsters.
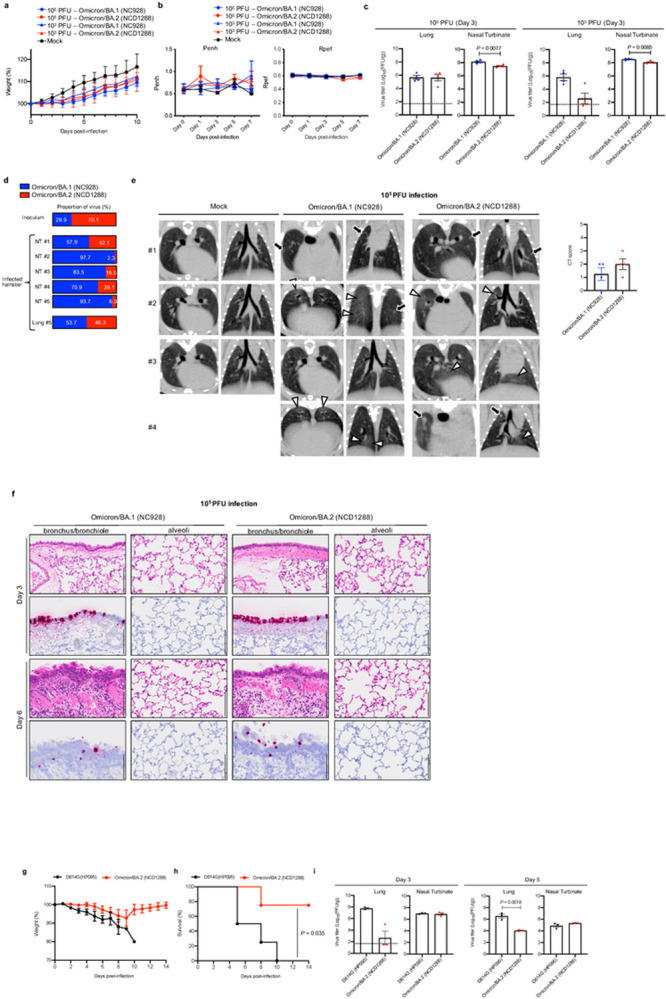
a–c, Syrian hamsters were intranasally inoculated with 105 or 103 PFU in 30 μL of Omicron/BA.1 (NC928), Omicron/BA.2 (NCD1288), or PBS (mock). a, Body weights of virus-infected (n=4) and mock-infected hamsters (n =3) were monitored daily for 10 days. Data are presented as the mean percentages of the starting weight (± s.e.m.). b, Pulmonary function analyses in infected hamsters. Penh and Rpef were measured by using whole-body plethysmography. Mean ± s.e.m. (BA.1- or BA.2-infected hamsters, n = 4; mock-infected hamsters, n =3). c, Virus replication in infected Syrian hamsters. Hamsters (n =4) were euthanized at 3 dpi for virus titration. Virus titers in the nasal turbinate and lungs were determined by plaque assay. Vertical bars show the mean ± s.e.m. Points indicate data from individual hamsters. The lower limit of detection is indicated by the horizontal dashed line. Data were analyzed by Mann-Whitney test (titers in the lungs of hamsters infected with 103 PFU) or unpaired student’s t-test (titers in the lungs of hamsters infected with 105 PFU and in the nasal turbinate of hamsters infected with 105 or 103 PFU). d, Co-infection with Omicron/BA.1 and Omicron/BA.2. BA.1 (NC928) and BA.2 (NCD1288) were mixed at an equal ratio on the basis of their infectious titers, and the virus mixture (total 2 × 10³ PFU) was inoculated into hamsters. Nasal turbinates and lungs were collected from the infected animals at 4 dpi and analyzed using next generation sequencing (NGS). Shown are the relative proportions of BA.1 and BA.2 in the infected animals. e, Representative micro-CT axial and coronal images of the lungs of mock-infected hamsters (n = 3), and four hamsters per group infected with 105 PFU of Omicron/BA.1 or 105 PFU of Omicron/BA.2 at 7 dpi. Lung abnormalities included minimal, patchy, ill-defined, peri-bronchial ground glass opacity (white arrowheads), and few, small, focal rounded/nodular regions (black arrows), consistent with minimal pneumonia. Coronal CT images were reformatted to optimize lesion visualization. CT severity scores for uninfected hamsters (n = 3) or those inoculated with 105 PFU of BA.1 (n = 4) or 105 PFU of BA.2 (n = 4) were analyzed by using the unpaired student’s t-test. Vertical bars show the mean ± s.e.m. Points indicate data from individual hamsters. f, Histopathological examination of the lungs of infected Syrian hamsters. Four hamsters per group were infected with 105 PFU of Omicron/BA.1 (NC928) or Omicron/BA.2 (NCD1288) and sacrificed at 3 or 6 dpi for histopathological examinations. Representative images of the bronchi/bronchioles and alveoli of hamsters infected with BA.1 or BA.2 are shown. Upper panels, hematoxylin and eosin (H&E) staining. Lower panels, in situ hybridization targeting the nucleocapsid gene of SARS-CoV-2. Scale bars, 100 μm. g-i, hACE2-expressing Syrian hamsters were intranasally inoculated with 103 PFU in 30 μL of D614G (HP095) or Omicron/BA.2 (NCD1288) g, h, Body weights (g) and survival (h) were monitored daily for 14 days. The values for body weights are presented as the mean percentages of the starting weight ± s.e.m. Survival data were analyzed by Log-rank (Mantel-Cox) test. i, Three hamsters per group were euthanized at 3 or 5 dpi for virus titration. Virus titers in the nasal turbinates and lungs were determined by use plaque assay. Vertical bars show the mean ± s.e.m. Points indicate data from individual hamsters. The lower limit of detection is indicated by the horizontal dashed line. Data were analyzed by Mann-Whitney test (titers in the lungs at 3 dpi) or unpaired student’s t-test (titers in the lungs at 3 dpi, and those in the nasal turbinates at 3 and 5 dpi). P values of < 0.05 were considered statistically significant.