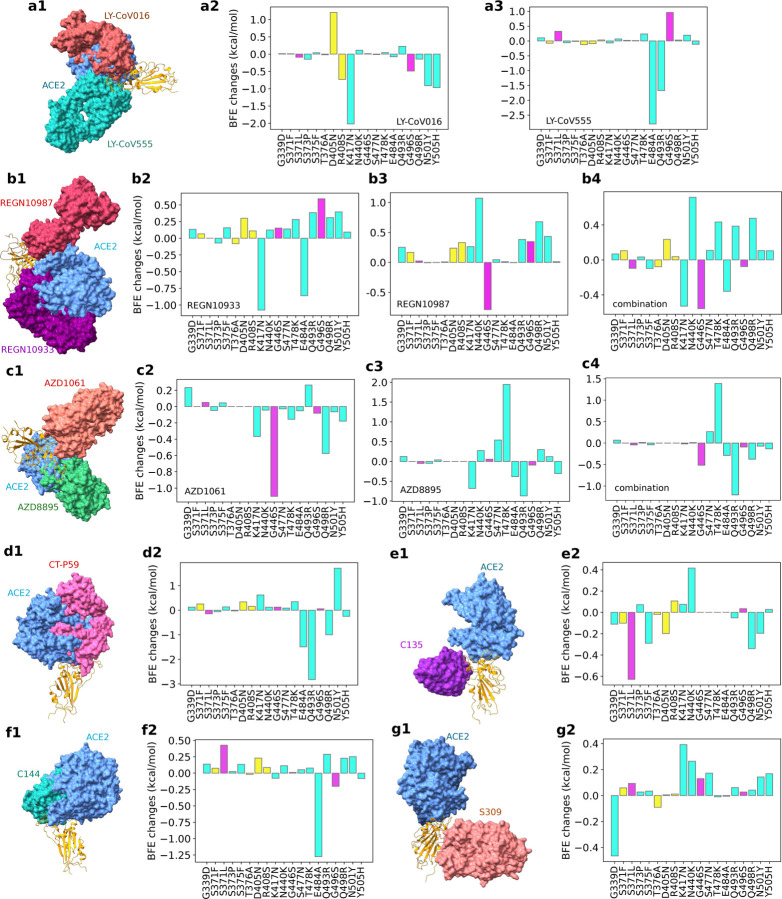
Figure 4:
Illustration of Omicron BA.1 and BA.2 RBD mutational impacts on clinical mAbs. a1, b1, c1, d1, e1, f1 and g1 depict the 3D structures of antibody-RBD complexes of Eli Lilly LY-CoV555 (PDB ID: 7KMG [23]) and LY-CoV016 (PDB ID: 7C01 [24]), Regeneron REGN10987 and REGN10933 (PDB ID: 6XDG [25]), AstraZeneca AZD1061 and AZD8895 (PDB ID: 7L7E [26]), Celltrion CT-P59 (aka Regdanvimab, PDB ID: 7CM4), Rockefeller University C135 (PDB ID: 7K8Z) and C144 (PDB ID: 7K90), and GlaxoSmithKline S309 (PDB ID: 6WPS), respectively. In all plots, the ACE2 structure is aligned as a reference. Omicron BA.1 and BA.2 RBD mutation-induced BFE changes (kcal/mol) are given in a2 and a3 for Eli Lilly mAbs, b2, b3 and b4 for Regeneron mAbs, c2, c3, and c4 for AstraZeneca mAbs, d2 for Celltrion CT-P59, e2 and f2 for Rockefeller University mAbs, and g2 for GlaxoSmithKline S309, respectively. Cyan bars label the BFE changes induced by twelve RBD mutations shared by BA.1, BA.2, and BA.3 subvariants. Magenta bars mark the BFE changes induced by three additional BA.1 RBD mutations. Yellow bars denote the BFE changes induced by four additional BA.2 RBD mutations.

