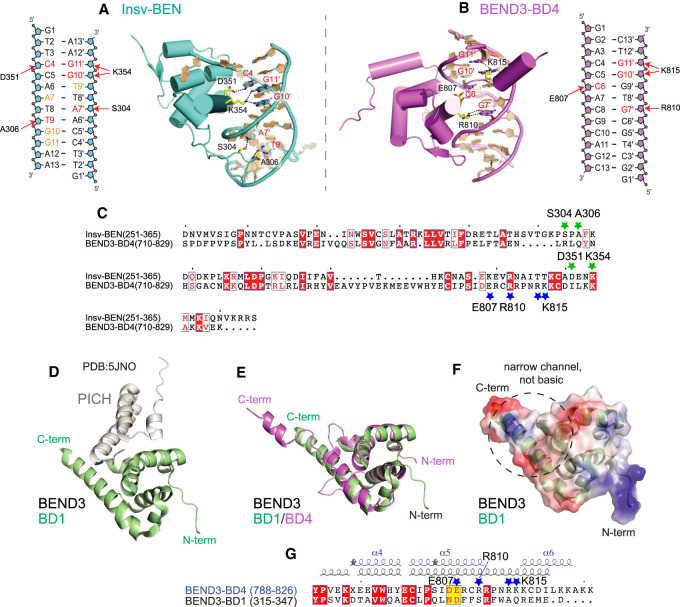
Figure 6.
Comparison of BEN domains that mediate DNA or protein interactions. (A–C) Comparison of base-specific interactions between the BEND3-BD4/DNA complex and the Insv-BEN/DNA complex (PDB: 4IX7). (A) Schematic and structural details of base-specific intermolecular hydrogen bonding contacts in the Insv-BEN/DNA complex. (B) Diagram and structural details of base-specific intermolecular hydrogen bonding contacts between BEND3-BD4 and the DNA target (involved residues are colored red). (C) Sequence alignment of Insv-BEN and BEND3-BD4. Conserved residues are colored white in the red boxes. The green and blue stars label positions of residues involved in base-specific interaction by the Insv-BEN and BEND3-BD4 domains, respectively. (D–G) Comparison of the BEND3-BD4/DNA complex with the BEND3-BD1/PICH-TPR complex (PDB: 5JNO) shows that their DNA-binding and protein-binding interaction surfaces are mostly distinct. (D) Cartoon view of the BEND3-BD1/PICH-TPR complex, with the BD1 domain in green and PICH in gray. (E) Superposition of the BD1 (green) and BD4 (violet) domains of BEND3. (F) Electrostatic surface representation of the BD1 domain of BEND3. BD1 lacks features that enable DNA binding by BD4 (Fig. 5B); namely, an open channel lined with basic residues that makes multiple contacts with DNA. (G) Sequence and secondary structure alignments of the C-terminal regions of the BD1 and BD4 domains of BEND3. Conserved residues are colored white in the red boxes, and the adoption of α helix, short helix turns (η), and β strand is labeled above. The dark-blue stars mark positions of residues involved in base-specific interaction in the BD4 domain.

